
Technical outlook:
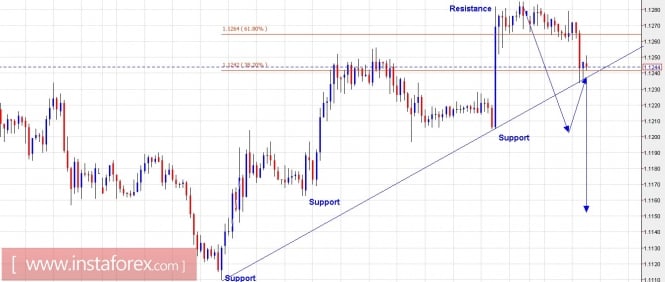
The EUR/USD pair continues to print fresh highs as once again Friday NFP helped the price hit 1.1285 levels before pulling back. The pair is likely on a high note after breaking above a trend line resistance on the daily chart last month (not shown here). At the same time, please note that there is enough divergence seen on daily charts and other time frames for a meaningful top to form, and the price is retracing lower towards 1.1000 levels at least before resuming higher again. We may not be selling aggressively now but would allow a break below 1.1200 levels before getting confirmation. Please wait for prices to break below its intermediary trend line support as depicted here and subsequently below price support at 1.1200 levels before again beginning to sell on rallies. Believe it or not, a top is very near now.
Trading plan:
Please remain flat for now, allow prices to drop below 1.1200 levels and then begin to sell on rallies with a stop above 1.1285 levels.
GBP/USD chart setups:
Technical outlook:
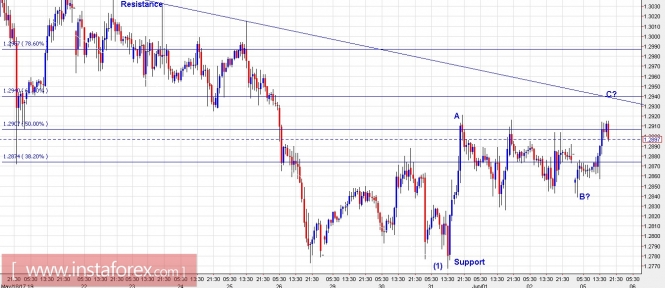
The GBP/USD pair seems to have already formed a meaningful top around 1.3047 levels earlier. If we look into the wave count, the pair had dropped towards 1.2767 levels earlier forming wave (1) and the subsequent rally has produced waves A and B until now. A push higher into 1.2940 levels would be ideal to go short again where wave C would also terminate and trend line resistance also passing. Until the price broadly stays below 1.3047 levels, we should be expecting lower lows and lower highs. Immediate resistance is seen at 1.3030/40 levels while support is seen at 1.2800 levels, respectively. GBP/USD has already hit 1.2940 levels and pulled back. It would be good to plan a short entry around these levels to see lower levels in the days to come.
Trading plan:
Please sell around 1.2930/40 levels, stop at 1.3049, targeting lower.
Fundamental outlook:
Please watch out for USD ISM Manufacturing Index to be out today at 10:00 AM EST for some quick volatility.
Good luck!
The material has been provided by InstaForex Company - www.instaforex.com