
The pair is hovering around the 200 SMA at H1 chart, with a resistance at 1.2911 helping to cap further gains. To the downside, GBP/USD should make a breakout below 1.2845 in order to resume the bearish structure and the efforts are getting weak for the buyers and that's why we would be watching for a consolidation above 1.2911 in order to test the 1.2962 level.
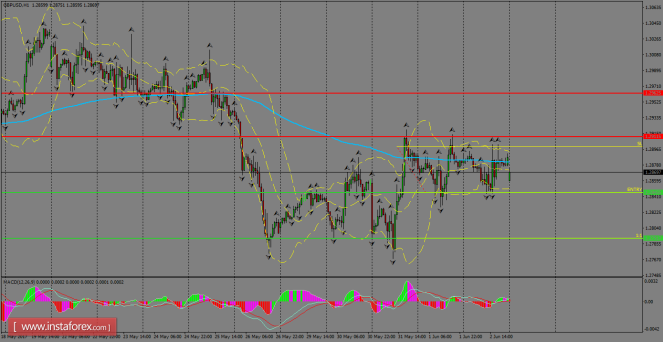
H1 chart's resistance levels: 1.2911 / 1.2962
H1 chart's support levels: 1.2845 / 1.2791
Trading recommendations for today: Based on the H1 chart, sell (short) orders only if the GBP/USD pair breaks a bearish candlestick; the support level is at 1.2845, take profit is at 1.2791 and stop loss is at 1.2900.
The material has been provided by InstaForex Company - www.instaforex.com