
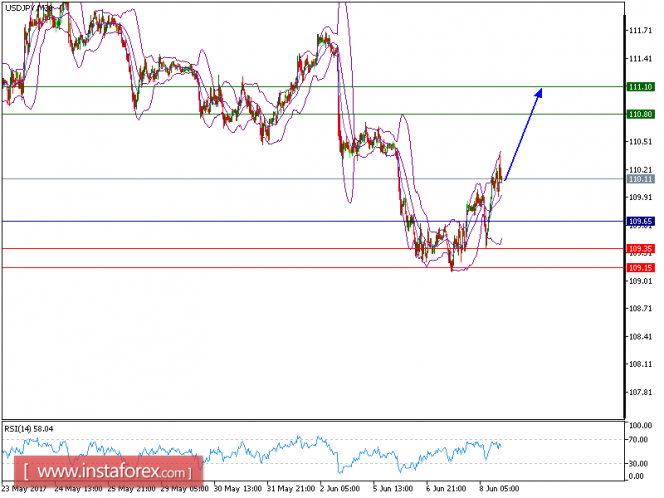
USD/JPY is expected to trade with bullish outlook above 109.65. The pair has formed an intraday rounding bottom, and is likely to post a new rise. The nearest key support at 109.15 should limit any downward attempts. Besides, both the 20-period and 50-period moving averages are turning up, and should push the prices higher. Last but not least, the relative strength index is supported by a bullish trend line.
Hence, as long as 109.65 is not broken, look for further advance to 110.80 and 111.10 in extension.
Graph Explanation: The black line shows the pivot point, the present price above pivot point indicates the bullish position and below pivot points indicates the short position. The red lines shows the support levels and the green line indicates the resistance levels. These levels can be used to enter and exit trades.
Strategy: BUY at dips, Stop Loss: 109.65, Take Profit: 110.80
Resistance levels: 110.80, 110.85, and 111.05
Support levels: 109.35, 109.15, and 108.65
The material has been provided by InstaForex Company - www.instaforex.com