
Yesterday's GBP/JPY target has been hit as presicted. Today, the pair is expected to extend its upside movement. The pair posted a rebound and broke above the 20-period and 50-period moving averages. In addition, the bullish cross between 20-period and 50-period moving averages has been identified, which indicates a positive signal. The relative strength index is above its neutrality level at 50. Hence, as long as 141.70 is not broken, expect a further upside to 143.10 and even to 143.460 in extension.
Hence, as long as 141.70 is not broken, expect a further upside to 143.10 and even to 143.460 in extension.
At present, the pair is trading above its pivot point. It is likely to trade in a higher range as long as it remains above its pivot point. Therefore, long position is recommended with the first target at 143.10 and the second one at 143.60. In the alternative scenario, short position is recommended with the first target at 141.40 if the price moves below its pivot points. A break of this target is expected to push the pair further downwards, and one may expect the second target at 140.70. The pivot point lies at 141.70.
Graph Explanation: The black line shows the pivot point, present price above pivot point indicates the bullish position and below pivot points indicates the short position. The red lines shows the support levels and the green line indicates the resistance levels. These levels can be used to enter and exit trades.
Strategy : BUY at dips, Stop Loss: 141.70, Take Profit: 143.10
Resistance levels: 143.10, 143.60, and 143.95
Support levels: 141.40,140.70, and 140
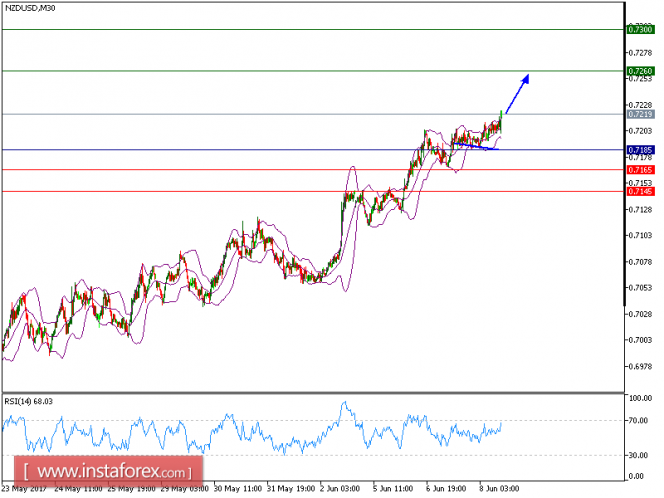
The material has been provided by InstaForex Company - www.instaforex.com