MG Network

something big isHappening!

In the mean time you can connect with us with via:

Copyright © Money Grows Network | Theme By Gooyaabi Templates

Money Grows Network

Archive

Powered by Blogger.

Welcome To Money Grows Network

Verified By

2006 - 2019 © www.moneygrows.net

Investments in financial products are subject to market risk. Some financial products, such as currency exchange, are highly speculative and any investment should only be done with risk capital. Prices rise and fall and past performance is no assurance of future performance. This website is an information site only.

Popular

Pages

Expert In

Name*


Message*

Ichimoku indicator analysis of gold for June 8, 2017

Gold price is showing reversal signs. It is still too early to tell if the pullback towards $1,250 we expect has started or something of a smaller degree. Important level to watch is at $1,277.

analytics5938f0db4d46c.jpg

Gold price has broken below the 4-hour tenkan-sen (red line indicator). This is the first bearish warning. Short-term support by the kijun-sen (yellow line indicator) is at $1,277.

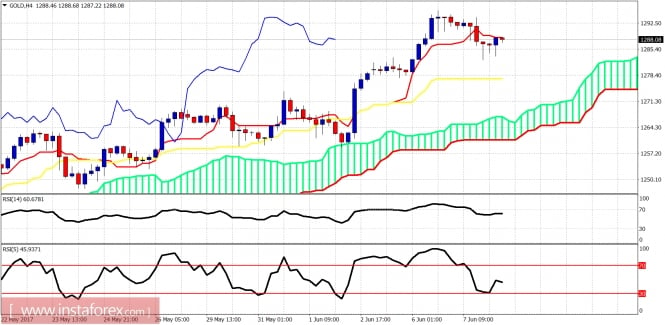
If this level is broken, a medium-term top will be in and a correction towards $1,250 will start.

analytics5938f138b1c59.jpg

Black line - resistance

Blue line - support

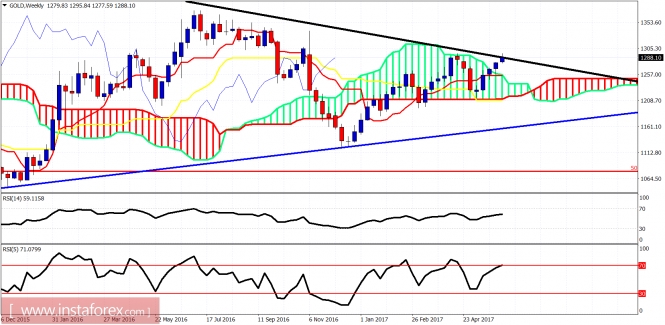
The weekly candle has broken out of the Kumo (cloud) and this is a very bullish sign. Price is testing important long-term resistance. A pullback towards the weekly cloud is expected before the next leg up that will eventually push price towards $1,400 and higher. I remain longer-term bullish about Gold and I believe bulls will get another opportunity to go long at lower than the current price levels.

The material has been provided by InstaForex Company - www.instaforex.com