
Technical outlook:
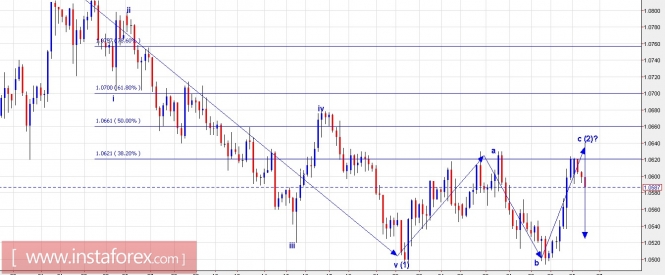
The EUR/USD 4H chart presented here indicates that a lower top is either formed or should be formed soon around 1.0700 levels. The alternate count was presented last week with a probability of a EUR/USD rally toward 1.0600 levels at least. The pair has now achieved those targets and should be getting on track lower. Please take profits if not realized yet, on the long positions initialized last week. The wave structure now looks to be a bit simplified with wave (1) produced earlier into 5 waves and followed by a flat a-b-c wave (2) as labelled here. It is still early to confirm that a top is in place since the pair can push higher through 1.0700 levels as well, which is fibonacci 0.618 resistance of drop between 1.0829 and 1.0492 levels earlier. Immediate resistance is still intact at 1.0680 levels while intermediary support is seen at 1.0492. Selling on rallies from here on is a favored strategy
Trading plan:
Please take profits on long positions and remain flat. Look to sell rallies through 1.0600 and 1.0700 levels, stop at 1.0850 and target 1.0300 and lower. Please note that targets would take a few weeks to hit but short positions can be taken now.
USD/JPY chart setups:
Technical outlook:
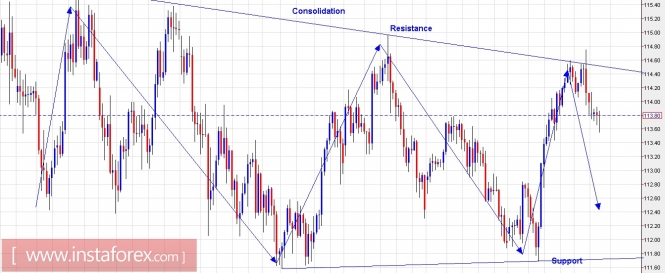
The USD/JPY pair is seen to be consolidating in a cone structure as presented on the 4H time frame here. As seen here, the pair has reversed from resistance trend line from 114.75 levels on Friday last after producing a wonderful rally from sub 112.00 levels. Please book profits on long positions, taken earlier, and look to enter short positions on intraday rallies. The structure is very simple and should be looking to push lower again until prices remain below 115.00 levels going forward. Immediate resistance is seen at 114.95 levels while support is at 111.70 levels respectively. The rally produced on Friday was the final leg within the consolidation. Selling intraday rallies is a favored strategy.
Trading plan:
Please book profits on longs, taken earlier, and remain flat for now. Look to sell intraday rallies toward 114.30 levels, stop at 115.00, target 112.00 at least.
Fundamental outlook:
USD Factory orders and Durable good are scheduled today at 10:00 AM EST but the impact should be medium to light. Please focus on Technical above.
Good luck!
The material has been provided by InstaForex Company - www.instaforex.com