
Gold price made a strong pull back and new lows last week but on Friday we saw a small bullish reversal signal. Prices reversed from $1,223 to above $1,235. Support at the last minute was held; however, it remains a negative sign the fact that we have broken below the $1,245 area.
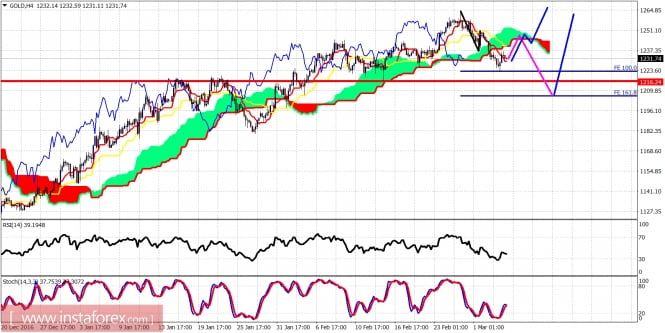
Blue lines - correction is over scenario
Gold price is trading below the Ichimoku cloud in the 4 hour chart. Trend is bearish for the short-term. Above I portray my two scenarios, both bullish for the medium to longer-term. However, the 1st scenario implies that a rejection around $1,250 could push price back towards $1,200-$1,180. A break above resistance at $1,250 could signal that an important low is in.
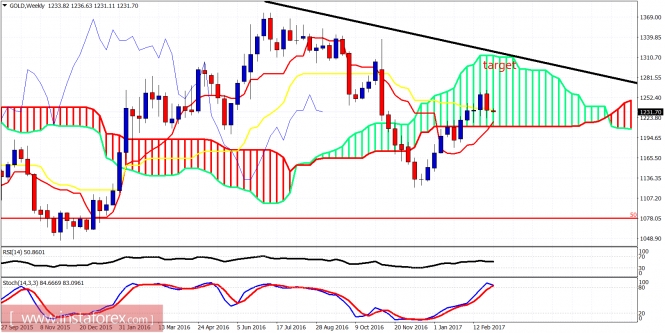
Very bad weekly candle was made last week; however, $1,220 support was held and as the tenkan-sen (red line indicator) is coming fast upwards from lower levels, we might find support at $1,220 stronger than initially expected and a cross between the tenkan- and kijun-sen could provide a bullish signal. Overall, my longer-term view remains bullish.
The material has been provided by InstaForex Company - www.instaforex.com