
The Dollar index is testing important resistance levels at 101.80-102. Short-term indicators are overbought and diverging. I expect the Dollar index to reverse from current levels. Key medium-term support is at 100.65, this week's low.
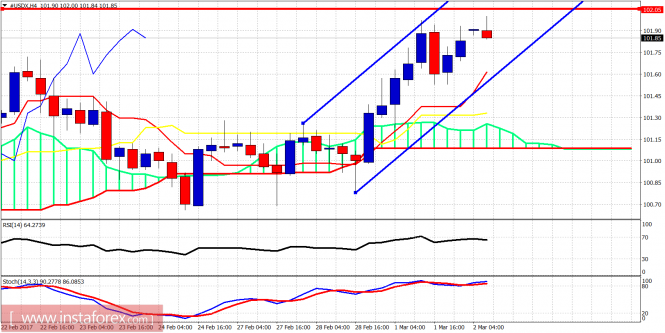
The Dollar index is trading above the Ichimoku cloud inside a bullish channel in the short term. Oscillators are diverging in the 4-hour chart from overbought levels. This implies at least a pullback. Support and target for such a pullback is at 101.60-101.30 area. If, however, the price breaks below 100.70 then we could expect more selling pressures.
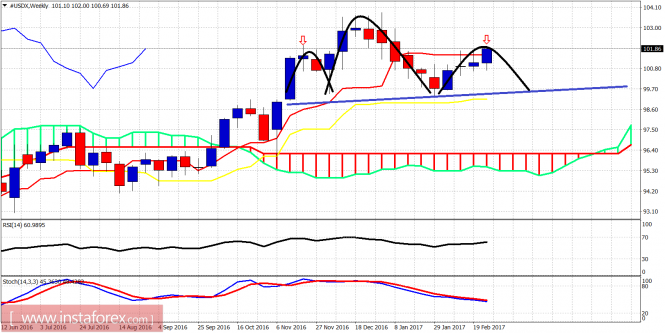
Black lines - Head and Shoulder (possible) pattern
The Dollar index is trading right at the same level with the highs of the left hand shoulder. As mentioned before, the uptrend stopping below 102 implies that we could be forming a Head and shoulders pattern and we are currently at the top of the right hand shoulder. For this to be a right hand shoulder, the price will need to turn down towards 100 and test the neckline support. As long as the price is above 99.25, the bulls are in control. Below 100.70 the bears will strengthen. Above 102 the bulls dominate.
The material has been provided by InstaForex Company - www.instaforex.com