
Gold made a low around $1,236 and bounced off critical short-term support. If recent low is broken we should expect the price to move towards $1,200. A break above $1,257 will open the way for $1,280-$1,300. I prefer the bullish scenario as the most probable one.
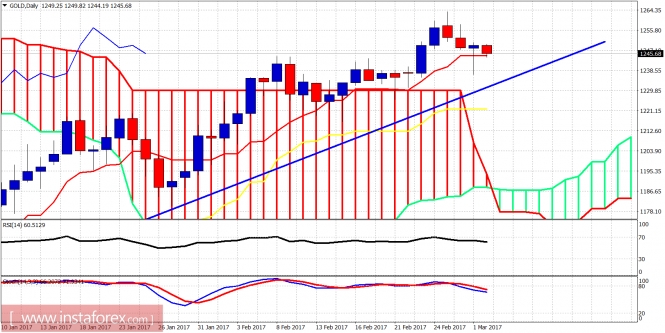
Blue line tested the daily tenkan-sen (red line indicator) yesterday and despite moving below it during the day, it closed above it and also gave us a bullish hammer pattern candle formation. Short-term support is at $1,236. Resistance is at $1,252 and then at $1,257. The bulls need to break above $1,257 to resume an uptrend.
 Blue line - support trend line
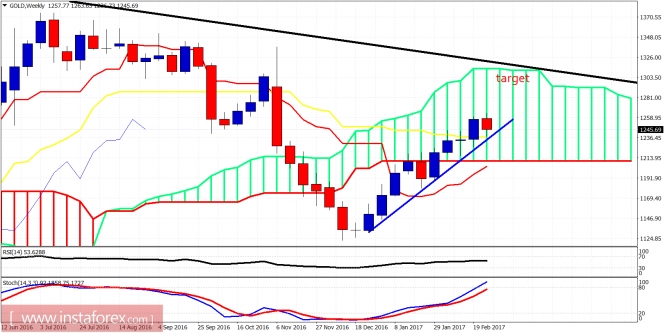
Black line - resistance trend line
The weekly chart remains bullish. The price remains above both the blue trend line and the weekly kijun-sen (yellow line indicator). Our target remains at $1,280-$1,320 area. There is no weekly divergence to warn us of a change in the medium-term trend.
The material has been provided by InstaForex Company - www.instaforex.com