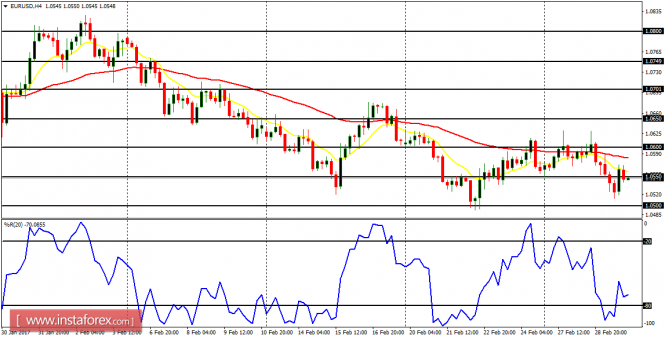
EUR/USD: There is a weak "sell" signal on this pair, which would become particularly strong once the price breaches the support lines at 1.0500 and 1.0450 to the downside. Since the EMA 11 is below the EMA 56, it is expected that the Williams' % Range period 20 would soon go into the oversold region. That is as the price heads further south.
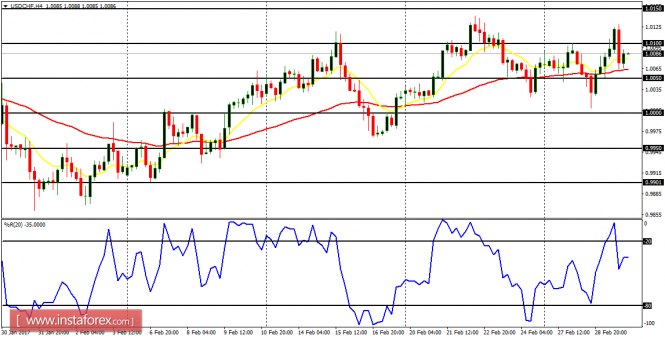
USD/CHF: The USD/CHF pair is currently trading above the support level at 1.0050, now closes to the resistance level at 1.0100. The outlook on the market is bullish and the price could test additional resistance levels at 1.0150 and 1.0200 this week (that is when there is a rise in the momentum).
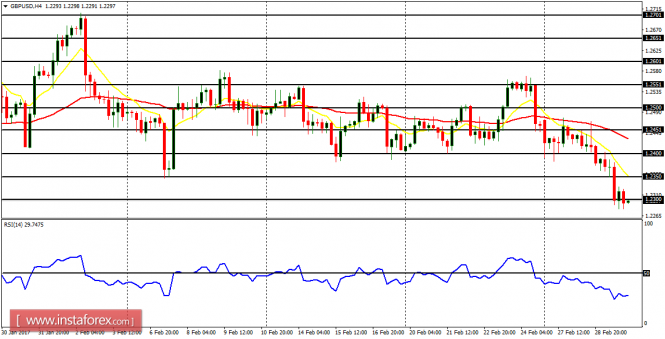
GBP/USD: The Cable has gone seriously southward this week – a movement of at least 170 pips to the downside. There is a strong bearish Confirmation Pattern in the chart and the price could easily test the accumulation territories at 1.2200, 1.2100, and 1.2000. It should be reminded that the outlook on the GBP pairs is somewhat bearish for this month.
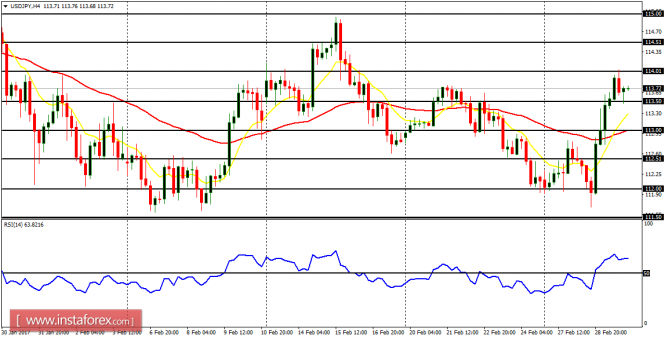
USD/JPY: There is now a bullish signal on the USD/JPY pair, as the price crosses the demand level at 113.50 to the upside. The next targets are located at the supply levels of 114.00, 114.50, and 115.00, which would be attained later today or tomorrow.
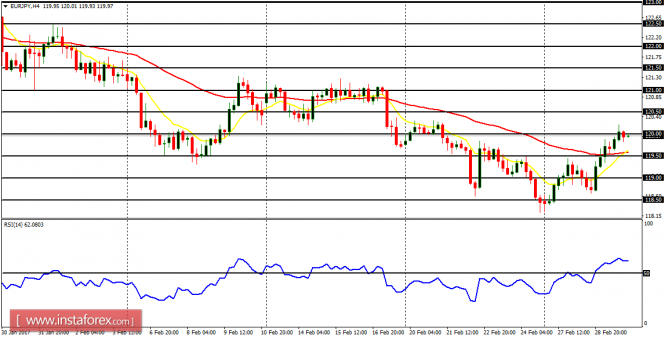
EUR/JPY: The EUR/JPY pair has been making bullish effort since the beginning of this week. The price has now moved above the demand zone at 119.50, now testing the supply zone at 120.00. As soon as the price crosses the supply zone at 120.50 to the upside, the EMA 11 would have gone above the EMA 56 (the RSI period 14 is already above the level 50). A bullish signal is now forming.