
The price is moving sideways in the short term. The price is making shallow pullbacks, another sign of strength. The trend remains bullish. Oscillators provide divergence signals but there is no reversal sign yet.
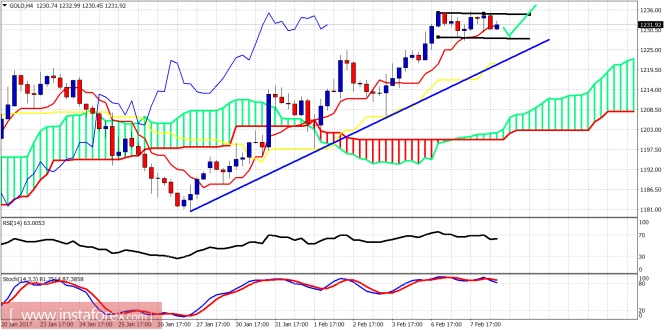
Black lines - sideways channel
Green lines - expected path
Gold continues to make higher highs and higher lows while it is trading above the Ichimoku cloud and the black trendline support. Short-term support is at $1,226 and resistance is at $1,237. The next pause in the trend is expected around $1,250.
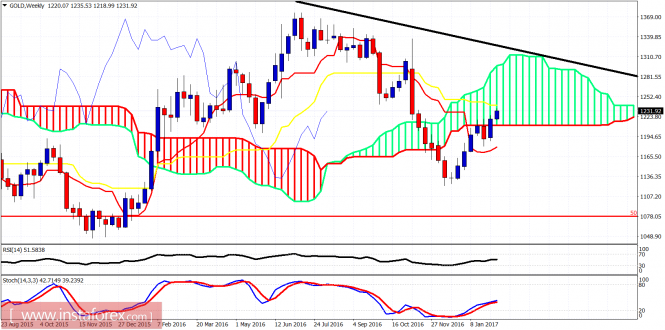
Gold is trading inside the weekly Ichimoku cloud. The kijun-sen resistance (yellow line indicator) is at $1,240. A weekly close above it will be a bullish sign impling a move towards the upper cloud boundary is coming. Oscillators are far from overbought on a weekly basis and that is why I believe the uptrend is far from being completed and the bulls should buy the pullbacks.
The material has been provided by InstaForex Company - www.instaforex.com