
The index is still moving inside a bullish tone across the board, as it remains supported by the 200 SMA at H1 chart. However, a breakout below 100.01 cannot be discarded at all, as the greenback could extend its bearish bias to test levels below the 100.00 handle. If USDX rallies toward 101.43, we can spot a hurdle around 102.00. MACD indicator is supporting the bearish scenario.
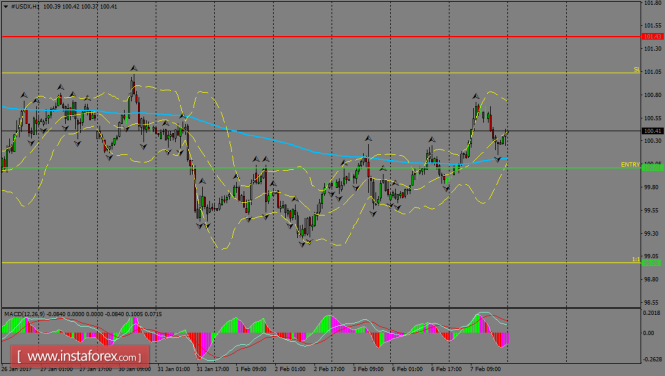
H1 chart's resistance levels: 101.43 / 102.38
H1 chart's support levels: 100.01 / 98.98
Trading recommendations for today: Based on the H1 chart, place sell (short) orders only if the USD Index breaks with a bearish candlestick; the support level is at 100.01, take profit is at 98.98 and stop loss is at 101.03.
The material has been provided by InstaForex Company - www.instaforex.com