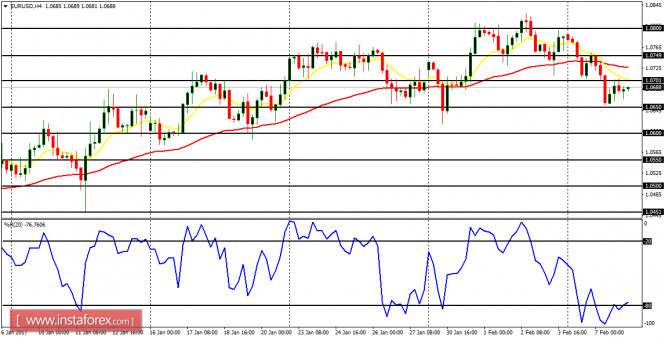
EUR/USD: The EUR/USD has gone down in the short-term, generating a short-term bearish signal. Price has gone down by more than 100 pips this week, now below the resistance line at 1.0700. The next target for bears is support line at 1.0650, which might even be breached to the downside.
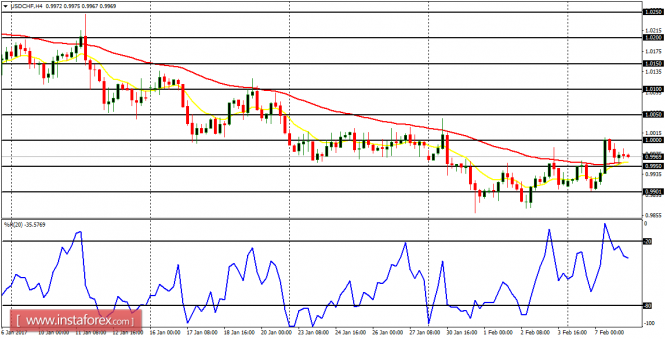
USD/CHF: This pair has rallied in the context of a downtrend. Price has been corrected to the upside, but that would not be a jeopardy to the extant bearish outlook, unless the resistance level at 1.0000 is breached to the upside. Price has tested the resistance line at 1.0000 but it was unable to breach it to the upside. Further decline is possible from here.
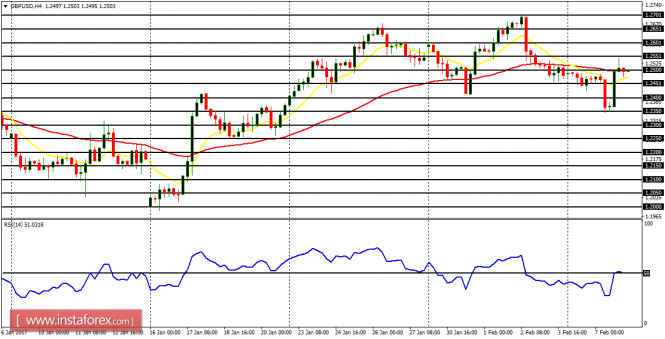
GBP/USD: The Cable has become volatile, and it has not gone in a directional mode this week. However, a directional movement is expected soon, which would most probably favor bears (and this would happen on most other GBP pairs). There could be transitory rallies, but bears would end up winning the battle.
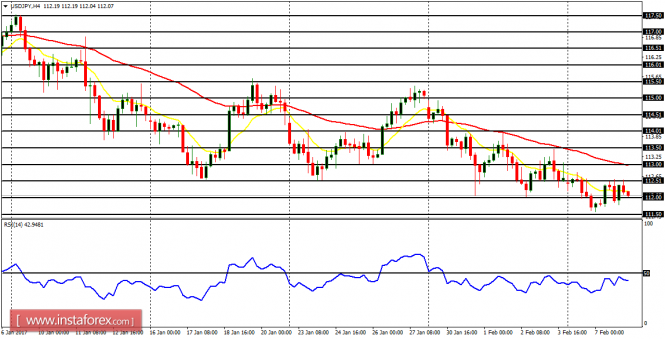
USD/JPY: This is a bear market, which has been unfolding within the last several weeks. The EMA 11 is below the EMA 56 and the RSI period 14 is below the level 50. Further decline is possible, but it is expected that JPY pairs would rally soon: the USD/JPY also included.
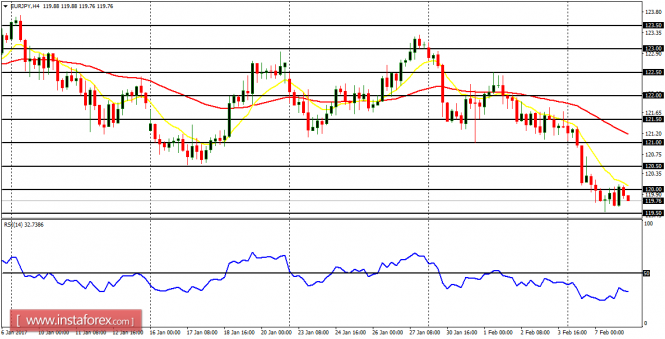
EUR/JPY: The EUR/JPY went further downwards this week, resulting in a Bearish Confirmation Pattern in the 4-hour chart, as price continued the bearish movement it started last week. Price is already under the supply zone at 120.00. While further decline is possible, the market could also rally.