
Analysis of previous deals:
30M chart of the EUR/USD pair
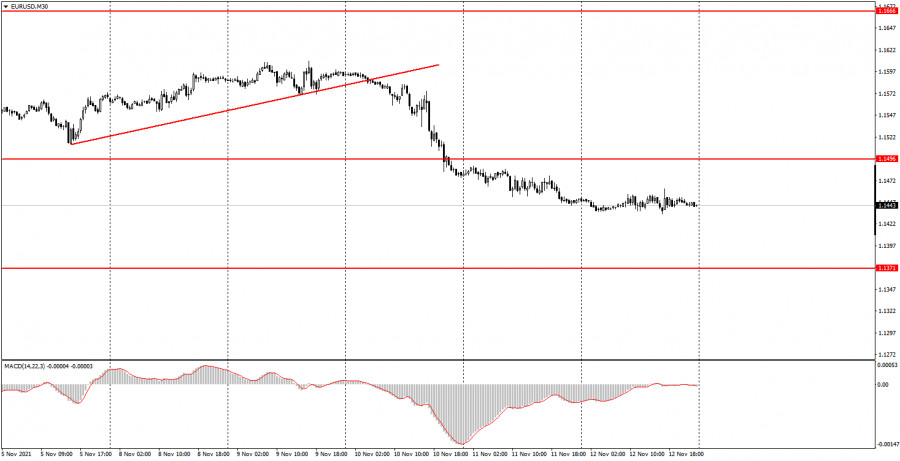
The EUR/USD pair traded in its usual manner on Friday. If on Wednesday the quotes overcame the distance of about 120 points, when the inflation report was published in America, then on all other days the volatility did not exceed 50 points. We have already said more than once that this is how the euro/dollar pair has been moving in recent months: one day - a volatile trend movement, three to four days - flat and zero volatility. This is exactly the picture we observed on Friday, when there was an absolute flat, and the pair passed from a low to a high of 29 points. Needless to say, with such volatility, even purely theoretical chances of profit were few, since the minimum Take Profit that we recommend is 30 points. Also, there is no talk of a trend line now on the 30-minute timeframe. One has already been canceled this week, but we immediately warned that it is very weak. There were no important macroeconomic statistics on Friday. The European Union released a report on industrial production for September, and in the US - the consumer sentiment index from the University of Michigan. However, both of these reports did not generate any reaction from the markets.
5M chart of the EUR/USD pair
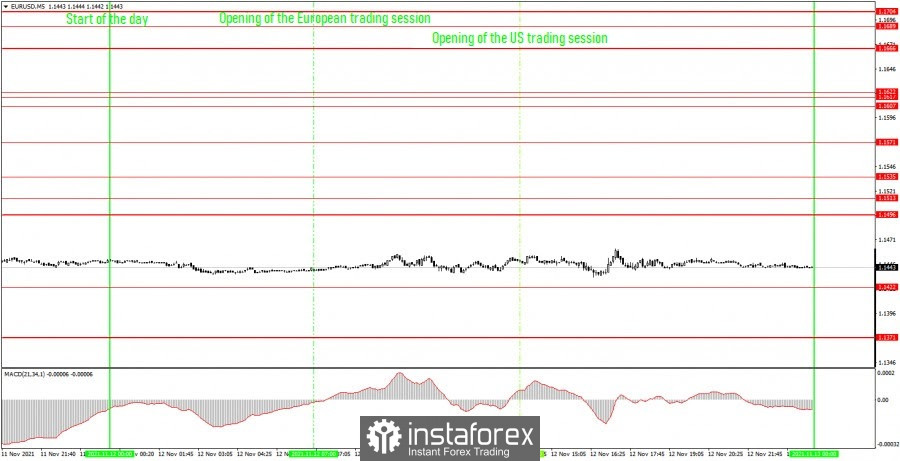
The picture is even more eloquent on the 5-minute timeframe. In principle, even any comments are superfluous here. The movement was just perfectly horizontal and it is very good that the price never worked out a single line during the day. Otherwise, there would be false signals and losses. Thus, the pair continues to remain near its annual lows and does not even try to correct. Therefore, the downward movement can resume at any time. However, unfortunately, the nature of the movement now is such that it is even difficult to guess on which day the pair will want to fall by 20-30 points. In general, novice traders should continue to analyze the situation very carefully and refuse to enter the market at the slightest sign of an intraday flat.
How to trade on Monday:
The downward trend is formally preserved on the 30-minute timeframe, but there is no trend line or trend channel. The pair did not move at all on Friday. The MACD indicator was at zero level half of Friday. Thus, the downward movement may continue with the target of 1.1371, but it will most likely be the same as we described above. On the 5-minute timeframe, the key levels for November 15 are 1.1371, 1.1422, 1.1496, 1.1513, 1.1535. Take Profit, as before, is set at a distance of 30-40 points. Stop Loss - to breakeven when the price passes in the right direction by 15 points. At the 5M TF, the target can be the nearest level if it is not too close or too far away. If it is located - then you should act according to the situation or work according to Take Profit. On Monday, nothing interesting is planned either in the US or in the European Union. Only the speech of the head of the European Central Bank Christine Lagarde, but she is unlikely to tell the markets anything important. You also need to be ready for this option, in particular, carefully monitor the price behavior during the speech.
Basic rules of the trading system:
1) The signal strength is calculated by the time it took to form the signal (bounce or overcome the level). The less time it took, the stronger the signal.
2) If two or more deals were opened near a certain level based on false signals (which did not trigger Take Profit or the nearest target level), then all subsequent signals from this level should be ignored.
3) In a flat, any pair can form a lot of false signals or not form them at all. But in any case, at the first signs of a flat, it is better to stop trading.
4) Trade deals are opened in the time period between the beginning of the European session and until the middle of the American one, when all deals must be closed manually.
5) On the 30-minute TF, using signals from the MACD indicator, you can trade only if there is good volatility and a trend, which is confirmed by a trend line or a trend channel.
6) If two levels are located too close to each other (from 5 to 15 points), then they should be considered as an area of support or resistance.
On the chart:
Support and Resistance Levels are the Levels that serve as targets when buying or selling the pair. You can place Take Profit near these levels.
Red lines are the channels or trend lines that display the current trend and show in which direction it is better to trade now.
The MACD indicator (14,22,3) consists of a histogram and a signal line. When they cross, this is a signal to enter the market. It is recommended to use this indicator in combination with trend lines (channels and trend lines).
Important speeches and reports (always contained in the news calendar) can greatly influence the movement of a currency pair. Therefore, during their exit, it is recommended to trade as carefully as possible or exit the market in order to avoid a sharp price reversal against the previous movement.
Beginners on Forex should remember that not every single trade has to be profitable. The development of a clear strategy and money management are the key to success in trading over a long period of time.
The material has been provided by InstaForex Company - www.instaforex.com