
GBP/USD 5M
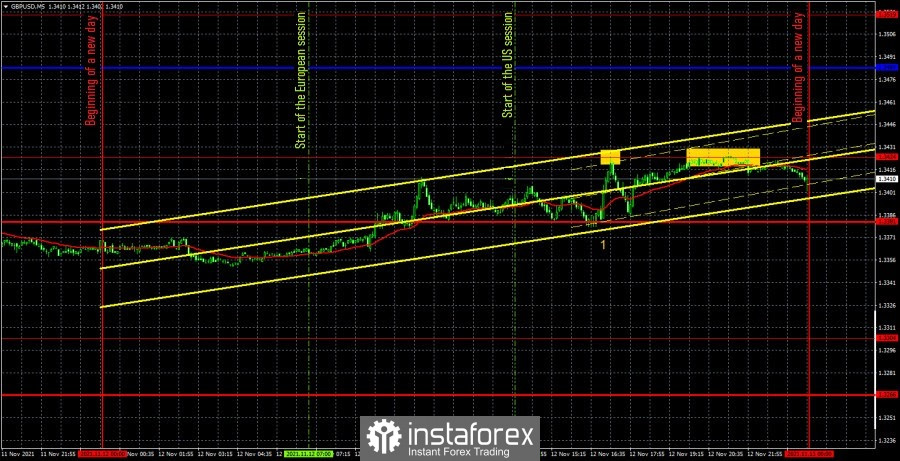
The GBP/USD pair traded rather weakly on November 12. Although the price passed about 70 points, the movement itself was quite strange, with sharp reversals and a very weak intraday trend. As in the case of the euro/dollar pair, it is very good that only two trading signals were formed during the day, one of which was immediately dismissed due to the fact that it was formed almost at the close of the market. Therefore, it remains only to deal with the sell signal, which was formed after the rebound from the extreme level of 1.3424. It should have been worked out, since the signals were strong. However, the price went down after it by only 24 points, which was enough to place a Stop Loss order at breakeven. According to this order, the short position eventually closed, as the price quickly returned to the level of 1.3424. Thus, there was also no profit or loss for the pound/dollar pair on Friday. The figure "1" in the chart marks the time when the consumer sentiment index report was published, after which the pair grew by 40 points. A strong enough reaction for such a weak report.
GBP/USD 1H
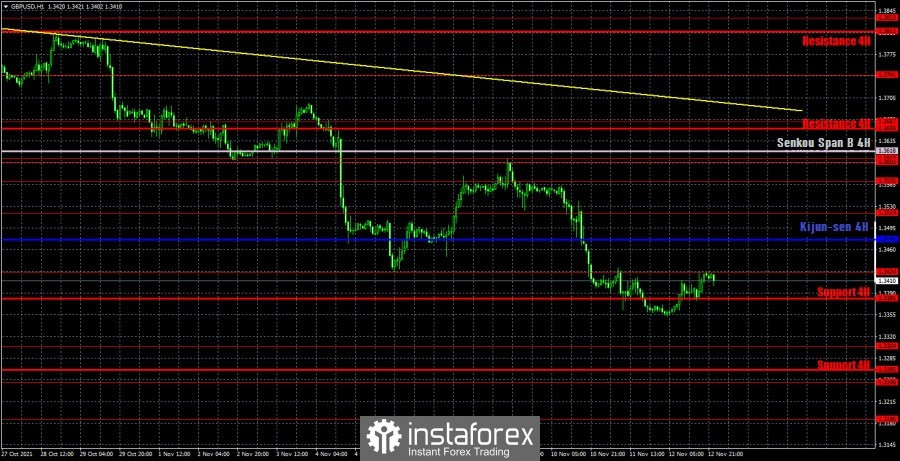
The pound/dollar pair maintains a downward trend on the hourly timeframe, as it continues to be below the trend line. At the moment, the pound/dollar pair is very close to its annual lows and very far from the trend line, so it has the opportunity to correct almost as much as possible and at the same time maintain the downward trend. The price also continues to be below the Senkou Span B and Kijun-sen lines. We highlight the following important levels on November 15: 1.3246, 1.3304, 1.3424, 1.3519, 1.3570. Senkou Span B (1.3618) and Kijun-sen (1.3476) lines can also be signal sources. It is recommended to set the Stop Loss level at breakeven when the price passes 20 points in the right direction. The Ichimoku indicator lines can move during the day, which should be taken into account when looking for trading signals. Nothing interesting is planned for Monday in either the UK or the US. Therefore, during the day, we expect a slight movement, most similar to what was observed on Friday.
We recommend you to familiarize yourself:
Overview of the EUR/USD pair. November 15. Does Jerome Powell have a real chance of keeping his post?
Overview of the GBP/USD pair. November 15. London threatened to use Article 16, but so far has changed his mind
Forecast and trading signals for EUR/USD for November 15. Detailed analysis of the movement of the pair and trade deals.
COT report
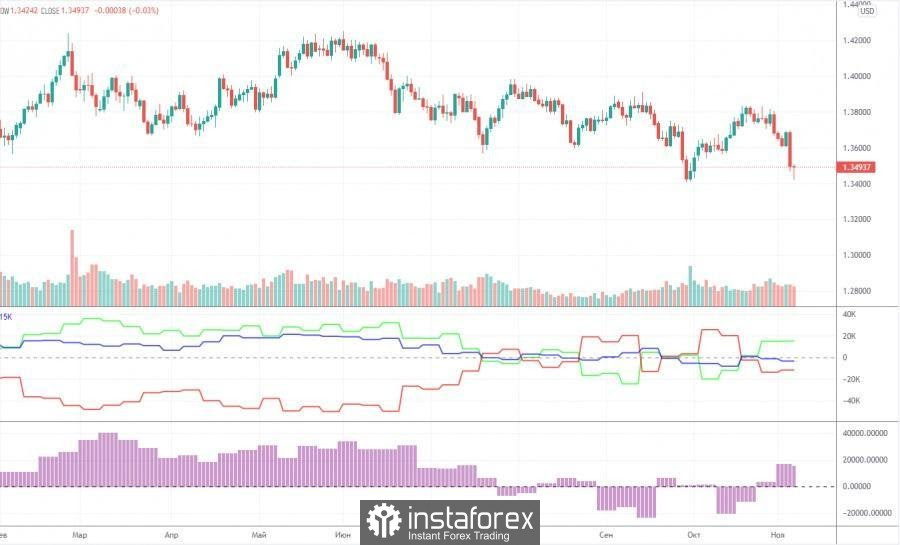
The mood of professional traders practically did not change during the last reporting week (October 26-November 1). However, it should be noted that the two most important days of last week – Wednesday and Thursday - when all the strongest movements occurred, were not included in the latest report. That is, in a week we will be able to see how much and in which direction the mood of professional traders has changed. In the meantime, we can only draw the same conclusions as a week ago. The green and red lines of the first indicator continue to constantly change the direction of movement, constantly intersecting. This suggests that big players themselves do not understand what to do with the pound. However, this can be clearly seen from the very schedule of the pair's movement, starting from July. These four months, the pound/dollar pair has been between the levels of 1.3400 and 1.4000, that is, in the horizontal channel. It was during this period of time that commercial and non-commercial traders changed their mood almost every week. Thus, taking into account the previous changes, we would assume that a new growth of the British currency will begin in the near future with the prospect of a 500-point rise. Moreover, the results of the Bank of England meeting were not dovish. The British currency has fallen undeservedly, which means that the markets may soon recoup this injustice. It should also be noted that during the reporting week, professional traders opened 5.8 buy contracts (longs) and 7.5 thousand sell contracts (shorts). Thus, the net position has not changed much.
Explanations for the chart:
Support and Resistance Levels are the levels that serve as targets when buying or selling the pair. You can place Take Profit near these levels.
Kijun-sen and Senkou Span B lines are lines of the Ichimoku indicator transferred to the hourly timeframe from the 4-hour one.
Support and resistance areas are areas from which the price has repeatedly rebounded off.
Yellow lines are trend lines, trend channels and any other technical patterns.
Indicator 1 on the COT charts is the size of the net position of each category of traders.
Indicator 2 on the COT charts is the size of the net position for the non-commercial group.
The material has been provided by InstaForex Company - www.instaforex.com