
To open long positions on GBP/USD, you need:
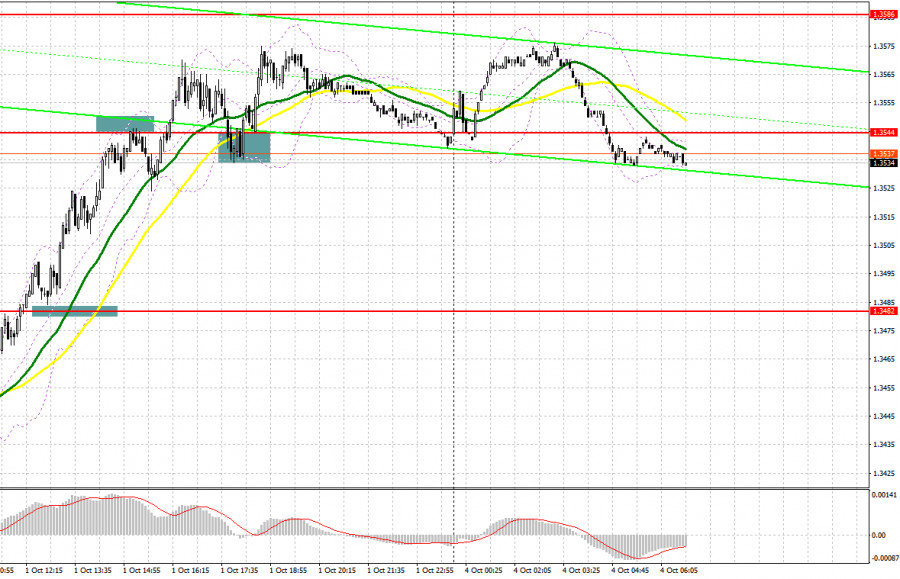
There were a lot of interesting signals to enter the market on Friday. Let's take a look at the 5 minute chart and break them down. In the first half of the day, after the breakthrough and consolidation above the level of 1.3482, a reverse test took place from top to bottom of this range, which resulted in forming a signal to open long positions in the expectation of an upward correction of the pound. Then a large rise to the 1.3544 area resulted in forming a false breakout and restrained the bulls' first attack, which led to a sell signal and a downward correction by 20 points within the day, which I drew attention to in my morning forecast on Friday. After that, a breakthrough and a test of the upside down resistance of 1.3544 took place, which resulted in forming another signal to buy GBP/USD.
Today we do not have important statistics for the UK and no matter how the situation that we watched on September 24 happened. The chart clearly shows how, after a large increase in the pound on September 23, the bears very quickly won back the entire movement and kept the market under their control. So be careful, especially at new weekly highs, as the entire calculation of the bulls will be on the breakthrough and consolidation above the resistance of 1.3572, which they rested against last week. A breakout of this level and a reverse test of it from top to bottom by analogy with the entry point, which I analyzed above from the level of 1.3544, will lead to forming a signal to buy GBP/USD in order to continue the upward correction to the high of 1.3613. The next target will be the area of 1.3643, where I recommend taking profits. The fact that trading is already above the moving averages once again confirms the likelihood of a continuation of the upward correction for the pound. In case GBP/USD falls in the first half of the day, it is necessary to pay attention to the level of 1.3525, below which these averages pass. Only a false breakout there generates a signal to open long positions against the trend with the expectation of a recovery to 1.3572. In case the pair falls further in the first half and the bulls are not active in this range, which is very important, it is best not to rush with long positions. The optimal scenario would be to buy the pound from the low of 1.3486, but also on condition of a false breakout. I advise you to open long positions in GBP/USD immediately on a rebound in the 1.3437 area, or even lower - from 1.3375, counting on an upward correction of 15-20 points within the day.
To open short positions on GBP/USD, you need:
The initial task of the bears is to protect the resistance at 1.3572, which may be tested in the near future, which will put them in a very delicate situation. Considering the absence of important statistics today and the improvement of the situation with the fuel crisis in the UK, it is possible that the pound will continue to rise. Only a false breakout at 1.3572 can seriously harm the bulls' plans. If the bears manage to defend the above range, we can expect GBP/USD to fall to the area of intermediate support at 1.3525. A breakthrough and reverse test of this area from the bottom up will hit the bulls' stop orders, which were already very active at the end of last week, which will form an additional entry point into short positions with the goal of pulling down GBP/USD to 1.3486. With very active short positions on the pound, the next target for the bears will be the lows of 1.3437 and 1.3375, where I recommend taking profits. If the bears are not active in the 1.3572 area, serious problems with a further bearish trend may begin. In this case, it is best to postpone selling until the next major resistance at 1.3613, from where you can open short positions immediately on a rebound, counting on a downward correction of 25-30 points within the day.
The Commitment of Traders (COT) reports for September 21 revealed both a sharp rise in short ones and an increase in those who bet on the pound's further growth. The Bank of England's monetary policy meeting last week had a significant impact on the sentiment of risky asset buyers. The decision to raise rates in November this year will provide support to bulls in case of any serious downward corrections in the pair, so it is best to bet on the growth of GBP/USD in the medium term. Deterioration in inflationary matters may force the BoE to act more aggressively, which is also another signal to buy the pound. The only problem that stands in the way of the bulls is the Federal Reserve, although it is not going to raise interest rates yet, but is also following the path of tightening monetary policy. The lower the pound falls, the more active buyers of risky assets will be, betting on real changes in the BoE's monetary policy in the future. The COT report indicated that long non-commercial positions rose from 44,161 to 51,910, while short non-commercials jumped almost one and a half times from 39,371 to 52,128, leading to a complete surrender of the bulls' advantage in the market and preponderance towards the bears. As a result, the non-commercial net position returned to its negative value and dropped from the level of 4,790 to the level of -218. The closing price of GBP/USD dropped 1.3837 to 1.3662 last week.
Indicator signals:
Moving averages
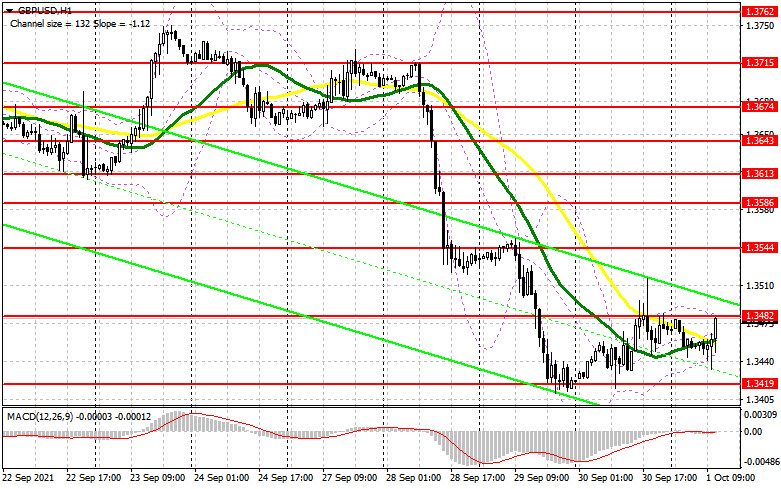
Trading is carried out above 30 and 50 moving averages, which indicates an attempt by the bulls to continue the upward correction in the pair.
Moving averages
Note: The period and prices of moving averages are considered by the author on the H1 hourly chart and differs from the general definition of the classic daily moving averages on the daily D1 chart.
Bollinger Bands
A breakthrough of the upper border of the indicator in the area of 1.3572 will lead to a new wave of growth of the pound. A breakout of the lower border in the area of 1.3525 will increase the pressure on the pair.
Description of indicators
- Moving average (moving average, determines the current trend by smoothing out volatility and noise). Period 50. It is marked in yellow on the chart.
- Moving average (moving average, determines the current trend by smoothing out volatility and noise). Period 30. It is marked in green on the chart.
- MACD indicator (Moving Average Convergence/Divergence — convergence/divergence of moving averages) Quick EMA period 12. Slow EMA period to 26. SMA period 9
- Bollinger Bands (Bollinger Bands). Period 20
- Non-commercial speculative traders, such as individual traders, hedge funds, and large institutions that use the futures market for speculative purposes and meet certain requirements.
- Long non-commercial positions represent the total long open position of non-commercial traders.
- Short non-commercial positions represent the total short open position of non-commercial traders.
- Total non-commercial net position is the difference between short and long positions of non-commercial traders.