Technical Market Outlook:
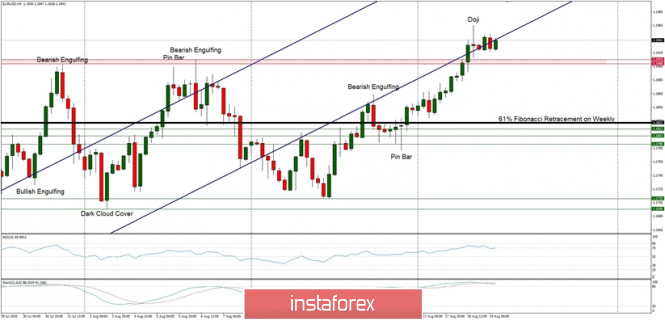
The EUR/USD pair has broken out from a narrow consolidation zone located between the levels of 1.1696 - 1.1915 and made a new swing high at the level of 1.1965. The recent wave up had been made on strong momentum, but the market conditions are now overbought, so a pull back might be just around a corner. Moreover, the last push up has ended with a Doji candlestick pattern, which is a potential trend reversal signal. The nearest technical support is seen at the level of 1.1880. The key technical resistance is the level of 1.1915 and if violated, then the next target is seen at 1.1962 and 1.2000.
Weekly Pivot Points:
WR3 - 1.2065
WR2 - 1.1962
WR1 - 1.1908
Weekly Pivot - 1.1808
WS1 - 1.1753
WS2 - 1.1661
WS3 - 1.1600
Trading Recommendations:
On the EUR/USD pair the main trend is up, which can be confirmed by 8 weekly up candles on the weekly time frame chart and 3 monthly up candles on the monthly time frame chart. This means any corrections should be used to buy the dips. The key long-term technical support is seen at the level of 1.1445. The key long-term technical resistance is seen at the level of 1.2555.