
From the comprehensive analysis side, you can see the update of the week's minimum, which confirmed the signal of price movement within the previous range, and now let's talk about the details.
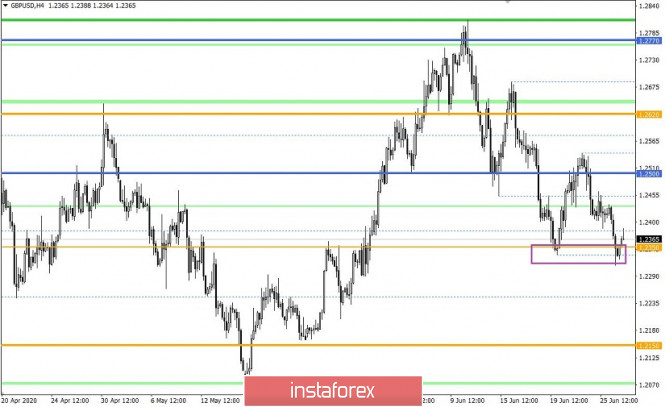
The last trading week began with a corrective move from the mirror level of 1.2350, where amid local activity of long positions, it was possible to return to the area of 1.2500/1.2540. Buyers did not succeed in breaking the downward tact from the range level of 1.2770, thus at this point, there was a recovery process that led to a breakdown of the average level of the range of 1.2150 // 1.2350 // 1.2620 and, as a fact, to updating the weekly minimum.
Maintaining the previous range is undeniable and everyone knows about it, repeated price consolidation outside the level of 1.2350 indicates holding short positions, which will eventually lead market participants to the level of 1.2150, thereby completing the monthly cycle.
Regarding the theories of market development, there is still a high speculative mood, which does not allow you to plan strategic positions, so traders continue to use local operations, working from surge to surge in the price.
Analyzing the Friday trading day by the minute, you can record a round of short positions that occurred during the start of the European session, but the main speculative excitement aimed at a downward move appeared at 11:00 and lasted until 14:30 UTC+00. The next one was in the form of a pullback with a slowdown within the 1.2350 level.
In terms of volatility, an acceleration of 64% is recorded relative to Thursday, but in terms of average daily dynamics, everything goes on as usual. Speculative excitement continues to be at a high level, which leads to consistently high rates of activity, literally on a daily basis.
As discussed in the previous review, traders worked downward, which as a result brought them another income to the trading deposit.
The trading forecast from Friday regarding short positions coincided: sell positions are considered below 1.2400, with the prospect of a movement to 1.2350.
Considering the trading chart in general terms (the daily period), you can see that the downward spiral from the range of 1.2350 is considered the main one in this measure, due to which the price of the frame returned to the previous range of 1.2150 // 1.2350 // 1.2620.
Friday's news background contained data on personal income and expenditure in the United States, which were conditionally neutral. Regarding statistics, here the income of Americans declined by 4.2%, while expenses rose by 8.2%.
In terms of the general information background, no matter the day, there is a new comment regarding the divorce proceedings of Brexit. So, this time, the head of the European Commission Ursula von der Leyen in an interview with Handelsblatt, said that there is no legal basis at this time for extending the transition period in the fall.
"The deadline for applying for an extension expires at the end of June. Therefore, it is clear that Great Britain will leave the single market on December 31." added Ursula von der Leyen.
The head of the European Commission noted that agreeing on the details of the agreement after October is unthinkable for us and would require a longer stay of the UK in a single market.
The coordination of all the details of the deal in theory should start now, so that everything can be done before the end of the year.
In turn, during a telephone conversation with his Polish counterpart, British Prime Minister Boris Johnson reiterated that England was ready to leave the EU without a trade deal if the parties were unable to agree. Johnson noted that London will try to conduct constructive negotiations with Brussels, but all this seems to be empty words and work for the public.
Today, in terms of the economic calendar, we have a package of data on the lending market in the United Kingdom, where the number of approved mortgage loans may be as much as 25 thousand against 15.85 thousand in the previous month. The volume of mortgage lending in May may be reduced by about 1-2 billion pounds, while consumer lending can be reduced by 2.5 billion pounds.

Further development
Analyzing the current trading chart, we can see a partial recovery process relative to Friday's decline, where the quote almost came close to a variable value of 1.2400, after which there was a slowdown.
The downward tact from the range level of 1.2770 is still relevant in the market, where traders are considering further movement in the range structure 1.2150//1.2350//1.2620.
It can be assumed that after a short pullback, the quote will return to the area of the mirror level of 1.2350 again, where it will form a variable fluctuation, relative to which the potential of the downward movement will be understood.
Based on the above information, we derive trading recommendations:
- Consider sell deals lower than 1.2310, with the prospect of a move to 1.2200-1.2150
- Consider buy deals if the pullback goes into correction and the quote manages to consolidate above 1.2400, towards 1.2450.
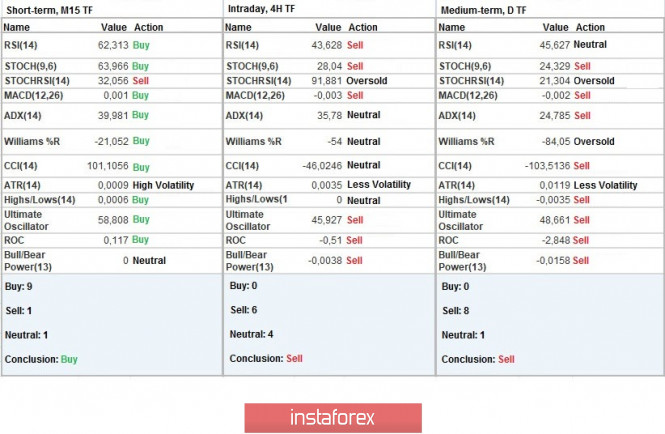
Indicator analysis
Analyzing a different sector of time frames (TF), we see that indicators of technical instruments on hourly and daily periods signal sales, by updating lows and consolidating prices within the mirror level.
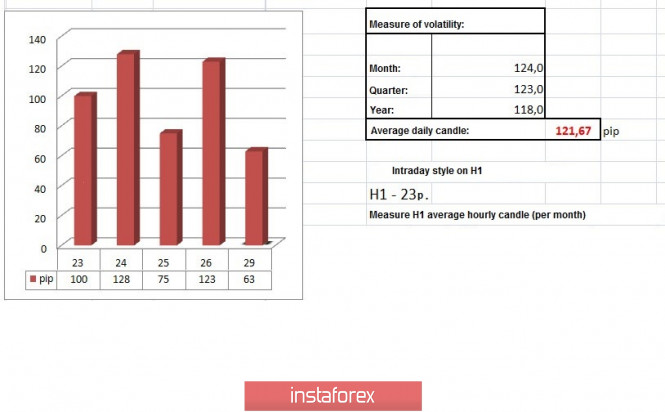
Volatility per week / Measurement of volatility: Month; Quarter; Year
Measurement of volatility reflects the average daily fluctuation, calculated for the Month / Quarter / Year.
(June 29 was built taking into account the time of publication of the article)
The current time volatility is 63 points, which is considered not a small indicator for the start of the European session. It can be assumed that this is not the end of the dynamics and with the arrival of Americans in the market, activity will continue to grow.
Key levels
Resistance Zones: 1.2500; 1.2620; 1.2770 **; 1.2885 *; 1.3000; 1.3170 **; 1.3300 **; 1.3600; 1.3850; 1.4000 ***; 1.4350 **.
Support Zones: 1.2350 **; 1.2250; 1.2150 **; 1.2000 *** (1.1957); 1.1850; 1.1660; 1.1450 (1.1411); 1.1300; 1.1000; 1.0800; 1.0500; 1.0000.
* Periodic level
** Range Level
*** Psychological level
**** The article is built on the principle of conducting a transaction, with daily adjustment
The material has been provided by InstaForex Company - www.instaforex.com