Crypto Industry News:
Just before halving, Bitcoin's Hash Rate has almost reached its new ATH. Unfortunately, shortly after halving (as expected by many analysts) we saw drastic drops. Citing data provided by blockchain.com, the 7-day average HR value of the BTC network increased for the first time since May 11. Admittedly, a small reflection of only 1% may suggest slow stabilization of this very important indicator.
May 22 Hash Rate fluctuated at 94.6 million H / s, the previous day the value was 93.6 H / s, which is an increase of 1.11%. Just before halving, the new ATH was at hand, but unfortunately everything indicates that we will have to wait for the new record.
Drastic drops in the power of the BTC network have caused concern among many analysts. Many claimed that Hash Rate fell into a "spiral of death" and fell to the bottom. A ray of hope gives the last positive reading.
After halving, as expected, many miners capitulated. Reducing the mining prize by half has pushed many out of the market.
The decrease in Hash Rate also had an impact on the amount of adjustment of the difficulty of digging BTC. This, in turn, fell from 16.1 T to 15.1 T. From a miner's point of view, this is a good signal, as it may encourage some of them to return.
Technical Market Outlook:
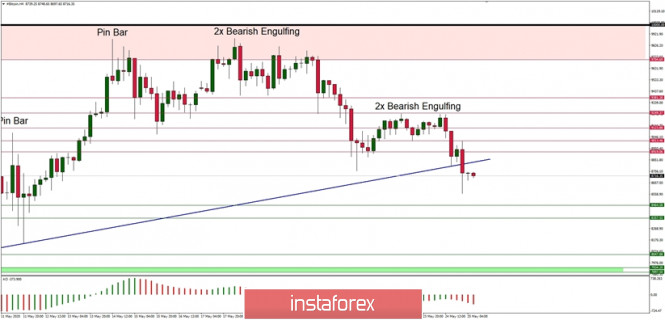
The BTC/USD pair has broken through the key trend line support located around the level of $8,800 and made a new local low at the level of $8,567. The next technical support is seen at the level of $8,464 and $8,357. On the other hand, the nearest resistance is located at the level of $8,919 and $9,013. The momentum remains weak and negative, so the odds for another wave down are high.
Weekly Pivot Points:
WR3 - $10,568
WR2 - $10,245
WR1 - $9,478
Weekly Pivot - $9,098
WS1 - $8,333
WS2 - $7,968
WS3 - 7,231
Trading Recommendations:
The larger time frame trend remains down and as long as the level of $10,791 is not violated, all rallies will be treated as a counter-trend corrective moves. This is why the short positions are now more preferred until the level of $10,791 is clearly violated. The key mid-term technical support is located at the level of $7,897.