
EUR/USD is trading at 1.0889 level and it continues to be under some bearish pressure after another false breakout above the near-term major resistance levels. It has opened with a minor gap down signaling that the bears are determined to push the rate down in the short term. The global economy is struggling to recover after the lockdown, even if the COVID-19 threat remains high.
The pair is trading in the red, the bias is bearish, as the US Dollar Index tries to climb higher after the last drop. USDX is trading at 99.87, most likely it will pass above the 100.00 psychological level again, so the EUR/USD could resume the downside movement. The dollar index has rebounded after the previous week's good US data, so a further increase will boost the USD, which will dominate the currency market.
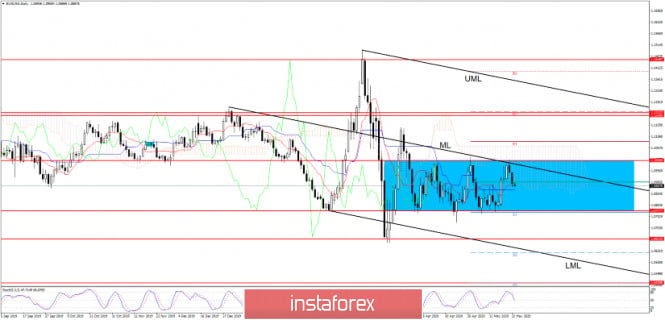
EUR/USD has been trading sideways, within an extended range, it has dropped below the Monthly Pivot Point (1.0905) level, a valid breakdown will confirm a drop at least till the 1.0777 static support.
The bearish pressure is still high as long as the price is holding below the median line (ML) of the black descending pitchfork. You can notice that EUR/USD has registered only another false breakout above the median line (ML) on Thursday signaling another bearish momentum.
EUR/USD has retested the Ichimoku cloud, the outlook is bearish as long as the price stays below this cloud. The next downside obstacle is seen at the 1.0777 level and at the S1 (1.0772) level, only a valid breakdown will validate a larger drop towards the lower median line (LML).
- EUR/USD Trading Tips
The false breakout above the 1.1 level and above the median line (ML) along with the Stochastic overbought has signaled another drop towards the 1.0777 range support. If you take a look at the H4 chart, you will notice that the price has confirmed the breakdown below the PP (1.0905) level by retesting this level, so a further drop is expected as long as the price stays below this broken downside obstacle.
A major drop will be confirmed after a valid breakdown below the 1.0777 static support and below the Monthly S1 (1.0772) level, the next targets are see at 1.0653, at the S2 (1.0592), and lower at the lower median line (LML). Ichimoku indicator could give us a selling signal if the Tenkan Shen (red) line will cross below the Kijun Sen (blue) line as long as EUR/USD is trading below the Ichimoku cloud.
EUR/USD larger drop could be invalidated by a valid breakout above the median line (ML) of the descending pitchfork. A valid breakout above the median line (ML) will signal a valid breakout above the 1.1000 level and a larger increase towards the upper median line (UML).
The material has been provided by InstaForex Company - www.instaforex.com