
To open long positions on EUR/USD, you need:
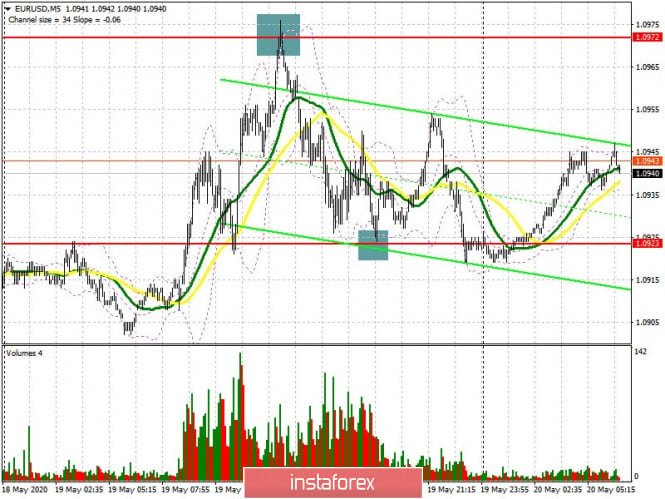
Yesterday, I paid attention to short positions from the 1.0972 resistance, and if you carefully look at my forecast for the US session and the 5-minute chart, you can see that the test of the 1.0972 level turned into a wave of euro decline following the speech of Federal Reserve Chairman Jerome Powell, who expressed concerns about the pace of recovery of the US economy. The bulls tried to buy from the 1.0923 level several times, but this did not lead to a rapid upward movement. At the moment, the entire focus is on this range, since forming a false breakout there will be a signal to open long positions in the euro. It is important to note that in general, as long as trading is conducted above this range, we can expect a second wave of growth of EUR/USD in the area of yesterday's high. But bulls imperatively need to break through and consolidate above the resistance of 1.0972, which will open a direct path to new levels in the area of 1.1013 and 1.093, where I recommend taking profits. If the pressure on the euro gradually returns, and it will happen immediately after the break of 1.0923, which repeatedly rescued buyers yesterday, then it is best to open long positions after the downward correction in the area of the low of 1.0890, or just on the rebound from support 1.0855 with a growth target of 30-35 points within the day.
To open short positions on EUR/USD, you need:
Important reports will be released today, this includes eurozone inflation, as well as the minutes of the April meeting of the Federal Reserve, which may negatively affect the European currency. Therefore, the main task of the bears for the first half of the day will be to return and consolidate EUR/USD below the 1.0923 level, since only then can we talk about the resumption of pressure, which will push the pair to the lows of 1.0890 and 1.0855, where I recommend taking profits. Also, sellers should not forget about protecting the 1.0972 resistance, but now I recommend opening short positions from there only after forming a false breakout, since the bulls could once again attempt to continue the upward correction after the data on inflation and other less important fundamental statistics for the eurozone are released. If you grow above the resistance of 1.0972, it is best to abandon short positions before updating the larger high of 1.1013, or sell the euro immediately on the rebound from the resistance of 1.093, in the expectation of a correction of 30-40 points within the day.
Signals of indicators:
Moving averages
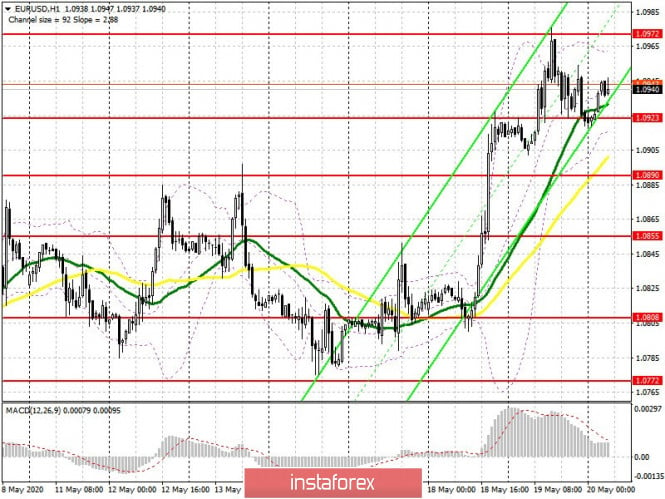
Trading is slightly above 30 and 50 moving averages, which indicates a slowing of the bullish momentum.
Note: The period and prices of moving averages are considered by the author on the hourly chart H1 and differs from the general definition of the classic daily moving averages on the daily chart D1.
Bollinger bands
A break of the lower border of the indicator in the region of 1.0920 will increase pressure on the euro, which will lead to another wave of decline in the pair. A break of the upper border of the indicator in the region of 1.0965, on the contrary, will lead to a new wave of euro growth.
Description of indicators
- Moving average (moving average determines the current trend by smoothing out volatility and noise). Period 50. The graph is marked in yellow.
- Moving average (moving average determines the current trend by smoothing out volatility and noise). Period 30. The graph is marked in green.
- MACD indicator (Moving Average Convergence / Divergence - Moving Average Convergence / Divergence) Fast EMA period 12. Slow EMA period 26. SMA period 9
- Bollinger Bands (Bollinger Bands). Period 20