
USD/JPY
It was expected that the USD/JPY pair would fall last Friday, the price returned to the area under the price channel line and also under the balance indicator line at the same time, staying in the accumulation range of 106.87-108.10.
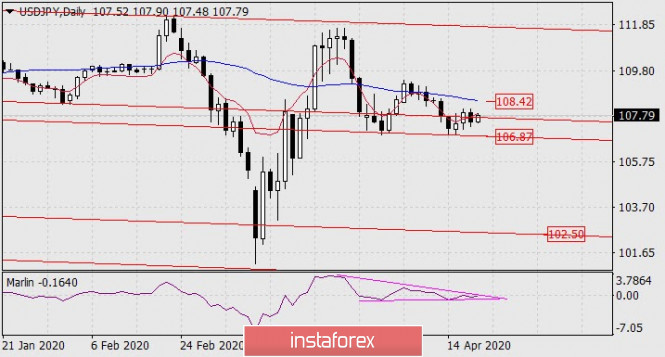
The Marlin oscillator line has formed a wedge on the daily chart, which creates a condition for the indicator to break down. Most likely, the price will work out support on the nearest line at 106.87, overcoming which subsequently opens the 102.50 target.
Price growth to 108.42 is quite possible as an alternative for the day. In order to do this, the price will need to go above the upper signal level of 108.10 (Friday high).
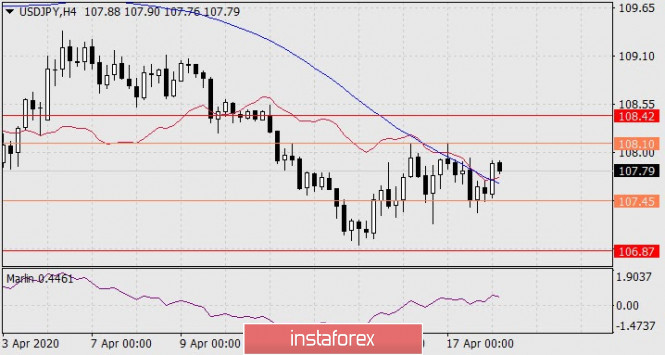
This morning the price jumped above both indicator lines on the four-hour chart - above the balance line (red) and the MACD line (blue). In addition, the Marlin oscillator turned up from the border of the bears' territory. The price has to leave these indicator lines as a prerequisite to resume the decline, below the 107.45 level. At the same time, the marlin signal line will move to the bearish zone.
The material has been provided by InstaForex Company - www.instaforex.com