
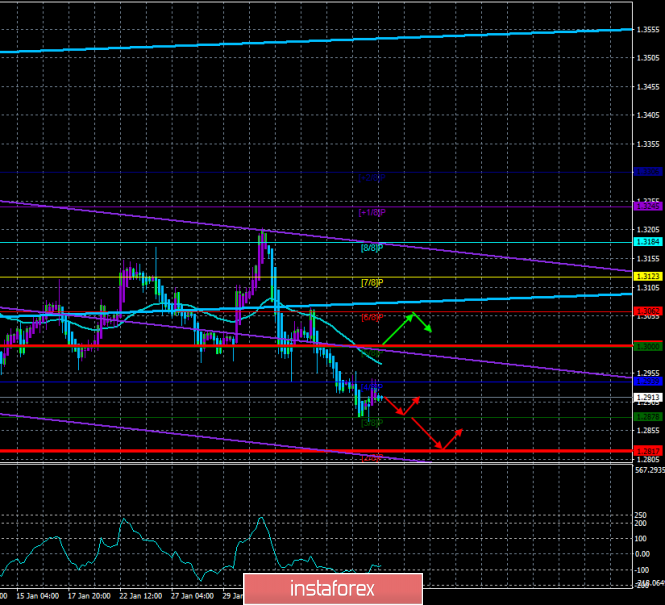
4-hour timeframe
Technical details:
Higher linear regression channel: direction - up.
Lower linear regression channel: downward direction.
Moving average (20; smoothed) - down.
CCI: -79.5400
The GBP/USD currency pair continues to adjust on February 11. After the pair worked the Murray level "3/8" - 1.2878, there was a rebound, which provoked the beginning of the correction. Also there weren't any important publications or speeches by top officials in the United Kingdom and the United States on the first trading day of the week. Thus, traders were deprived of fundamental recharge on February 10. Therefore, Monday was, in principle, a good option for a correction, although we expected that the downward movement will continue. However, the Heiken Ashi indicator turned up and signaled a temporary break in the downward movement. It should also be noted that on Tuesday, that is, today, information from the UK that is of a very important degree of significance will come from the UK. Therefore, before such an important block of macroeconomic data, traders recorded part of the profit on short positions previously opened.
Now we turn directly to macroeconomic statistics. The most significant indicator, of course, will be the indicator of GDP. However, you should immediately make a reservation that tomorrow there will be at least four variations of this indicator, moreover, with different values. For example, GDP for December will be published, that is, in monthly terms with a forecast of +0.2%. An estimate of GDP growth rates from NIESR for January will also be published with a forecast of +0.2%. Preliminary data on Gross Domestic Product for the fourth quarter in annual and quarterly terms with forecasts of +0.8% and +0.0% from the National Statistics Office will be published. We believe that it is the last two indicators that are the most significant. Take a look at the chart.
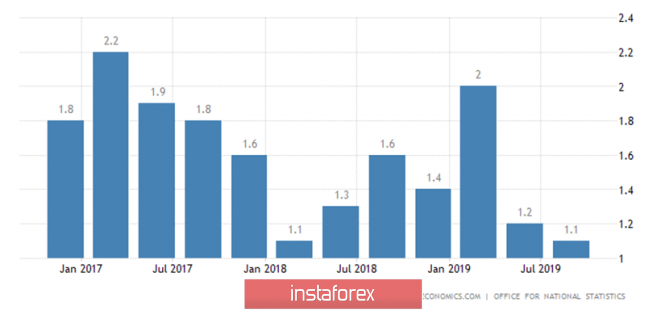
Over the past three years, UK GDP has shown even more or less strong GDP growth. That is, each quarter there was an increase in comparison with the same quarter of the previous year by no less than 1.1%. 1.1% is, of course, not much, however. GDP forecasts for the fourth quarter of 2019 indicate that growth rates may decline to 0.8% y/y. That is, for the first time in the last three years (and in fact for the first time since 2010), the growth rate will be less than 1% y/y. This is what we have repeatedly said when we covered the problem of a slow down in Great Britain's economy. The economy continues to lose money, problems associated with Brexit and the uncertainty surrounding the trade deal with the European Union continue to negatively affect the business climate and the desire of entrepreneurs to invest. Moreover, certain companies are leaving the UK, some are cutting production on its territory, some are moving their financial centers outside of Great Britain. Of course, all this negatively affects the economy.
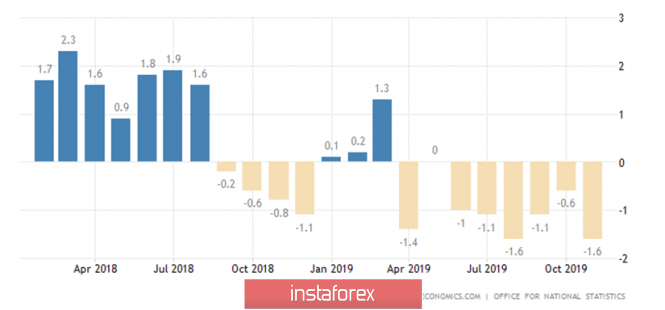
The next indicator is industrial production. Here things are even worse than with GDP. In annual terms, industrial production has been declining for a year and a half almost every month. Tomorrow it is expected that this indicator will lose its regular 0.8% in annual terms, and will add 0.3% in monthly terms. It is clear that even if the annual indicator is slightly better than expected, it is still unlikely to get out of the negative zone. Thus, both main indicators of tomorrow should significantly exceed forecast values in order to trigger purchases of the British pound.
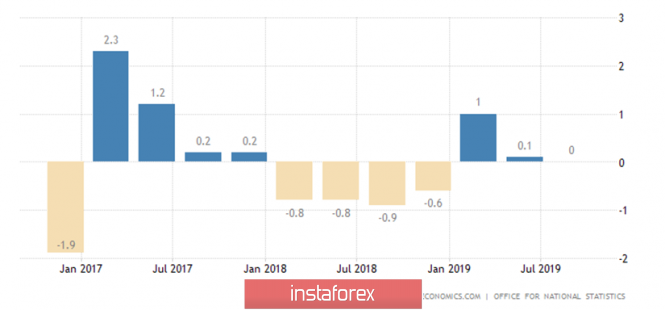
We would also like to draw the attention of traders to the indicator of the volume of commercial investments, which, although not as important as the first two indicators, still reflects the essence of what is happening. Judging by the data for the last 12 months, investment volumes are also more often declining than growing. For tomorrow, the forecast is -1.3% in the fourth quarter on an annualized basis. And what do we have in the end? The three most significant indicators for the UK economy over the past year and a half have only been doing so, which are declining. For tomorrow, all three indicators have negative forecasts. What growth of the British pound in the long run can be discussed with such macroeconomic statistics? We are still wondering why the Bank of England didn't soften monetary policy at the last meeting and where did it see "economic recovery after the December elections"? We notice only an even greater reduction in key indicators. And again, it is worth noting that all this happens before the official breakdown of all ties between London and Brussels, which is scheduled for December 31, 2020. That is, in fact, Brexit has not even begun. Now only preparations are underway for him.
From a technical point of view, all indicators show a downward movement, except for the higher linear regression channel. Thus, the overall trading strategy remains the same - downward trading, especially since there are not even any corrections now.
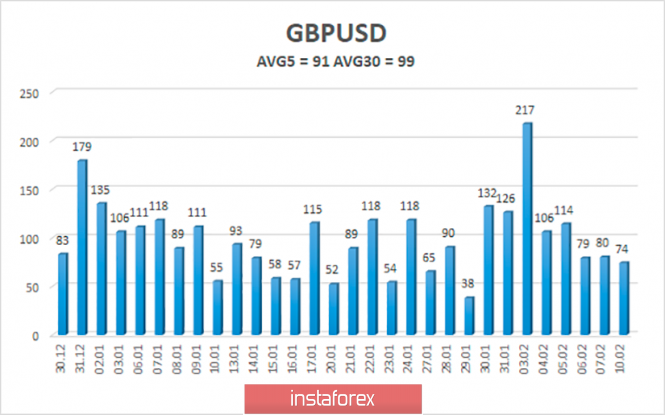
The average volatility of the pound/dollar pair has dropped to 91 points over the past five days, and the volatility illustration clearly shows that in the last 6 days it has been reduced. According to the current level of volatility, the working channel on February 11 will be limited by the levels of 1.2821 and 1.3003. The resumption of the downward movement would be very logical on Tuesday, given the fundamental background. A turn of the Heiken Ashi indicator down will indicate the completion of a round of corrective movement.
Nearest support levels:
S1 - 1.2878
S2 - 1.2817
S3 - 1.2756
The nearest resistance levels:
R1 - 1.2939
R2 - 1,3000
R3 - 1.3062
Trading recommendations:
GBP/USD is adjusted. Thus, traders are now advised to wait until the correction is completed and resume selling the pound with goals of 1.2878 and 1.2821. It is recommended to consider purchases of the British currency after the price is consolidated above the moving average line with the first objectives of 1.3062 and 1.3123.
In addition to the technical picture, fundamental data and the time of their release should also be taken into account.
Explanation of illustrations:
The highest linear regression channel is the blue unidirectional lines.
The smallest linear channel is the purple unidirectional lines.
CCI - blue line in the indicator regression window.
Moving average (20; smoothed) - a blue line on the price chart.
Murray levels - multi-colored horizontal stripes.
Heiken Ashi is an indicator that colors bars in blue or purple.
Possible price movements:
Red and green arrows.
The material has been provided by InstaForex Company - www.instaforex.com