
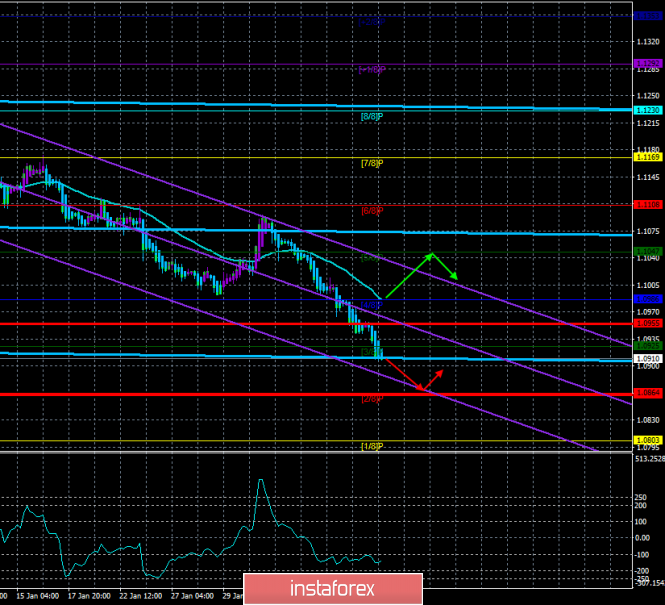
4-hour timeframe
Technical details:
Higher linear regression channel: direction - sideways.
Lower linear regression channel: downward direction.
Moving average (20; smoothed) - down.
CCI: -148.5069
The EUR/USD currency pair did not start a highly anticipated upward correction on Friday or Monday. Instead, it continues to retreat for the seventh day in a row and came close to two-year lows near the level of 1.0879 yesterday. Since the fall in this price area was rapid and recoilless, it is most likely that these lows will be updated the other day. However, now we would like to note the groundlessness of the euro's fall on Monday, February 10. There was no important news that day. No macroeconomic publications or speeches by top officials of the United States or the European Union. Why, instead of a very logical correction, did the fall continue? Yes, we have repeatedly said that the fundamental background remains entirely on the side of the US dollar. But the euro is "now empty, then thick." Either the currency pair stomps on the spot when there is every reason for the trend movement, then it tumbles down when more calm trading can be expected. In any case, despite some strangeness of the current downward movement, from a fundamental and macroeconomic point of view, it is fully justified.
The only macroeconomic report of the past day was industrial production in Italy. We believe that this is far from the most significant indicator, however, let us examine in more detail the indicators of industrial production in other EU countries.
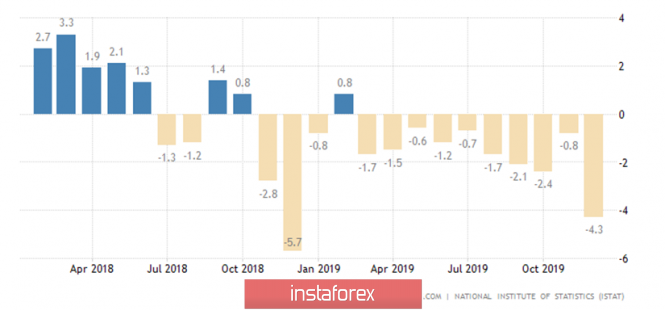
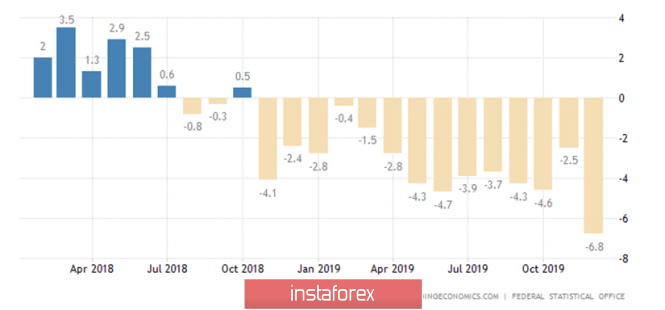
The graph clearly shows the state of industrial production in Italy over the past two years. Eight out of 24 months showed a decrease compared to the same period last year. Moreover, it should be understood that the current -4.3% y/y refers to the period of the previous year, in which a decrease of 0.8% y/y was also recorded. That is, a decrease of 0.8% was recorded in December 2018 and 2019 - a decrease of another 4.3%. Accordingly, the decline in industrial production is now no longer relative, but absolute. Let's look at the pictures in other EU countries.
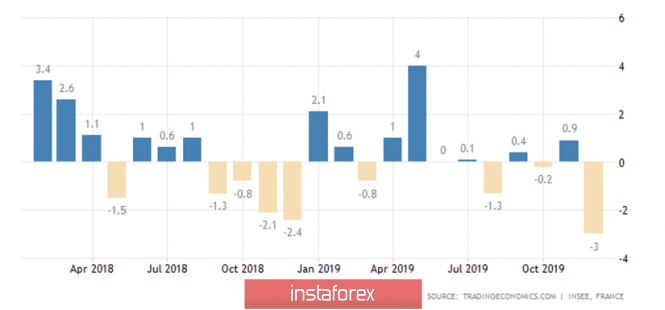
France. The situation is a little better; there is no monthly income reduction as certain as in Italy. However, there are few reasons for joy. The values of the indicator over the past two years signal stagnation, that is, the absence of a clear increase.
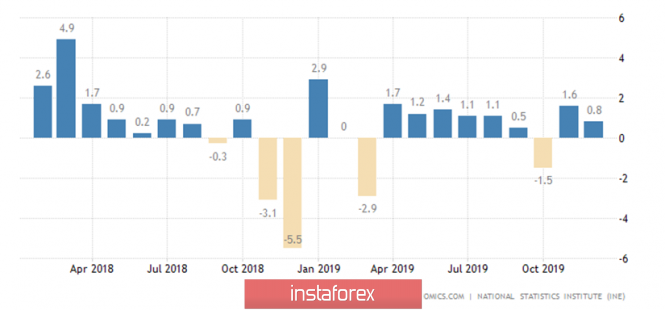
Spain. The situation is a little better than in France. In the last year, almost all months closed with minimal, but still growth. Although, a fall of 5.5% was suddenly recorded in November 2018.
In the case of Germany, everything is not just bad, but is actually a failure! The rate of decline in industrial production is huge, the last month with a value of -6.8% is evidence of this. We can say with confidence that it is precisely the German indicator that pulls down the pan-European indicator of industrial production to the greatest extent.
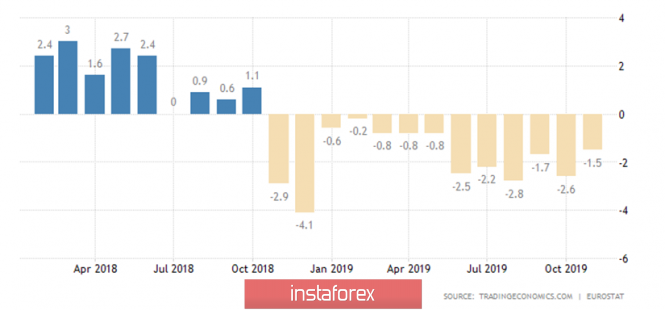
The indicator of industrial production throughout the eurozone. Everything is in the red in the last thirteen months. Is it worth it to once again make a correlation between industrial production and GDP, the main indicator of the state of any economy? GDP in the eurozone has slowed to 1.0% y/y in recent months, while it remains at a very decent level of + 2.1% in the United States. Maybe this is the reason for the continued fall of the European currency?
No important macroeconomic publications are planned in the European Union on the second trading day of the week. Traders will have to focus on the speech of Fed Chairman Jerome Powell in Congress, the essence of which, by and large, is already known and understood. But now what to expect from the euro is very difficult to say. Given the groundlessness of the new fall of the euro on Monday, this movement may continue on Tuesday and Wednesday. Very much like an uncontrolled collapse. Thus, the overall trading strategy for the euro/dollar pair remains the same - selling before the appearance of signals for correction.
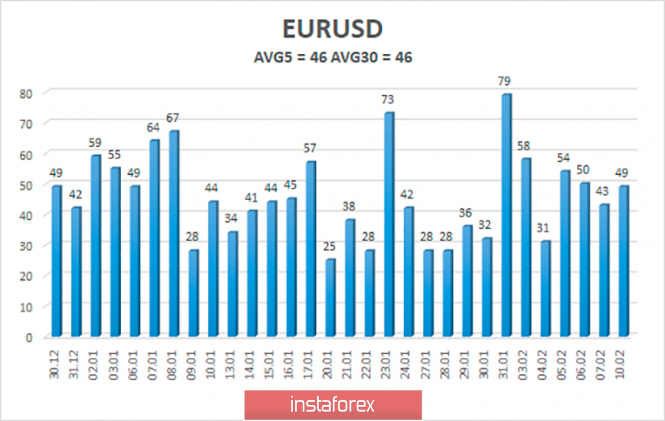
The average volatility of the euro/dollar currency pair again fell slightly and is now 46 points per day. Despite the decrease in volatility, the downward movement continues completely without corrections. Thus, on Tuesday we expect movement between the boundaries of the volatility band of 1.0863 - 1.0955. We are still expecting a correction, but earlier we did not recommend shortening shorts before the Heiken Ashi indicator reversed upwards.
Nearest support levels:
S1 - 1,0864
S2 - 1,0803
S3 - 1.0742
The nearest resistance levels:
R1 - 1,0986
R2 - 1.1047
R3 - 1,1108
Trading recommendations:
The euro/dollar continues to move down. Thus, selling the euro while aiming for 1.0864 and 1.0803, until the Heiken Ashi indicator is up, are still relevant. It is recommended to return to buying the EUR/USD pair no earlier than the bulls overcoming the moving average line, which will change the current trend to an upward one, with the first goals of 1.1047 and 1.1108.
In addition to the technical picture, fundamental data and the time of their release should also be taken into account.
Explanation of illustrations:
The highest linear regression channel is the blue unidirectional lines.
The smallest linear regression channel is the purple unidirectional lines.
CCI - blue line in the indicator window.
Moving average (20; smoothed) - a blue line on the price chart.
Murray levels - multi-colored horizontal stripes.
Heiken Ashi is an indicator that colors bars in blue or purple.
Possible price movements:
Red and green arrows.
The material has been provided by InstaForex Company - www.instaforex.com