
In December, the price, having strayed from the support line (blue bold line), went up. Moving upward, the pair reached 13 average EMA - 1.1209 (yellow thin line). An important boundary in January will be the level of 1.1285 - 21 average EMA (black thin line). Most likely, in January, it is possible to continue the upward movement.
Trend analysis.
In January, it is possible to continue the upward movement with the first goal of 1.1185 - 21 average EMA (black thin line). If this level is broken, the next target is 1.1412 - the upper fractal.
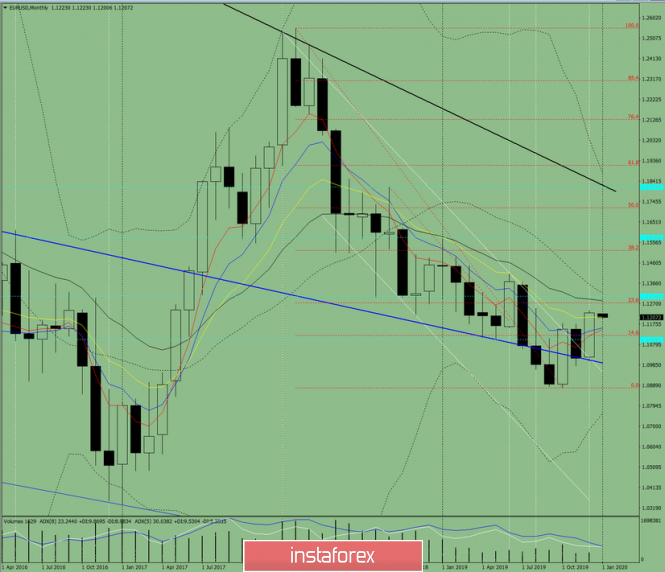
Fig. 1 (monthly chart).
Indicator analysis:
- Indicator analysis - up;
- Fibonacci levels - up;
- Volumes - up;
- Candle analysis - up;
- Trend analysis - up;
- Bollinger lines - down;
he conclusion of comprehensive analysis - the top job.
The total result of calculating the candle of the EUR/USD currency pair according to the monthly chart: the price will most likely have an upward trend with the absence of the first lower shadow (first week of the month - white) and the absence of the second upper shadow (last week - white).
The lower scenario is unlikely. However, the first lower target of 1.1105 is the historical support level (blue dotted line).
The material has been provided by InstaForex Company - www.instaforex.com