
4 hour timeframe
Technical details:
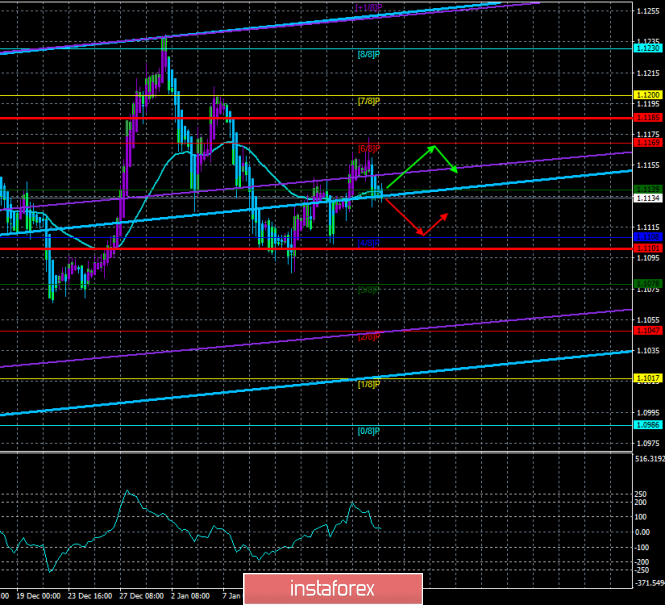
Senior linear regression channel: direction - upward.
Junior linear regression channel: direction - upward.
Moving average (20; smoothed) - sideways.
CCI: 25.1866
On Friday, January 17, the EUR / USD currency pair begins with a downward correction against the upward trend, since the pair recently managed to overcome the moving average line. However, during the upward movement, traders failed to overcome the Murray "6/8" level of 1.1169, from which there was a rebound, and now the pair is quoted near the moving average, again deciding what to do next: to rebound and resume growth or to return to a more justified downward movement, from a fundamental point of view. Yesterday's daytime news reaffirms that point of view, which does not particularly need proof in recent months. The American statistics showed another very good value and exceeded forecasts, while European statistics (German CPI) showed no positive dynamics, again. Thus, the Euro currency fell anew, which is quite logical,
Also, over the past day, a protocol was published from the last meeting of the ECB, which was the first for Christine Lagarde. No one doubted that at her first meeting as head of the Regulator, Lagarde would not initiate a change in the key rate. In principle, she herself stated that it would take several months to evaluate all the possibilities and the need for structural changes in the Central Bank, as well as monetary policy. The minutes of that meeting confirmed that the European Central Bank is currently taking a wait and see attitude. At the same time, most members of the monetary committee considered certain optimistic signs in the current state of things.
According to the members of the monetary committee, political risks began to decline, and the inflationary pressure is to decrease, at the same time, the manufacturing sector began to show signs of recovery. According to members of the ECB, this is the first sign that the situation has begun to improve. Since we do not sit at the ECB, it is difficult for us to draw a similar conclusion, because we only see specific macroeconomic statistics. And these statistics do not indicate, for example, that business activity in the manufacturing sector of the EU countries which begun to grow. Nevertheless, ECB chief economist Philip Lane said:
"The data from the last meeting on monetary policy indicated the continuing weak but stabilizing growth dynamics of the Eurozone."
It should also be noted that in the coming months, the ECB should decide on a strategy that will be applied in the work in the coming years.
The publication of the December inflation is scheduled on the last day of the European Union trading week. We will then be able to make sure that the ECB is right in speaking of some signs of economic recovery or to verify the opposite. Considering the fact that German inflation remained unchanged in December and British inflation slowed down to 1.3% y / y, and acceleration of European inflation, on the other hand, can hardly be expected. According to experts, inflation in the EU will remain unchanged at 1.3% y / y. We believe that this is the most optimistic forecast. In the best case, inflation will indeed be 1.3%, in the worst, it will start to slow down again. Thus, the euro can today be under pressure from market participants.
Separately, it is also worth considering the report on industrial production in the USA. If everything is clear in the European Union, the business activity in the manufacturing sector has long been in the "red zone", industrial production itself is declining, and in the case of the States, everything is not so obvious. Business activity in the manufacturing sector by the ISM index is also in the "red zone" of 47.1, however, the Markit index indicates that "everything is in order", amounting to about 52. But a report on industrial production today may show a decrease in volumes in December by 0.2% m / m. What is it? An accident? Or the consequences of a trade war with China? Will there be a reflection on other economic indicators or will the Fed skillfully smooth out the negative effect of Trump's trade wars? One way or another,
The technical picture on January 17 indicates that the pair is preparing to resume a downward trend. If the Murray "5/8" level of 1.1139 is overcome, then the trend will again become downward.
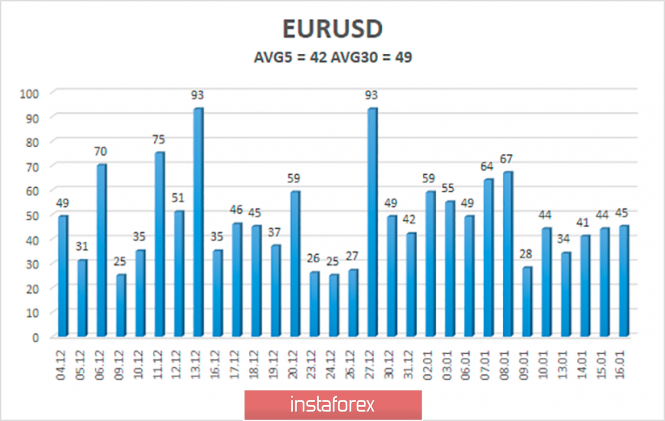
The average volatility of the EUR/USD currency pair is currently 42 points. Thus, we have volatility levels on January 17 at 1.1101 and 1.1185. A turn of the Heiken Ashi indicator up will indicate the resumption of the upward movement. However, we still expect a resumption of the downward movement.
Nearest support levels:
S1 - 1.1139
S2 - 1.1108
S3 - 1.1078
The nearest resistance levels:
R1 - 1.1169
R2 - 1.1200
R3 - 1.1230
Trading recommendations:
The EUR/USD is currently being adjusted again. Thus, long positions (formally) with goals 1.1169 and 1.1185 are relevant now, however it is recommended to open them very carefully with small lots. It is recommended that returning to sales of the pair with a target of 1.1108 is not earlier than the reverse overcome by moving traders.
In addition to the technical picture, fundamental data and the time of their release should also be taken into account.
Explanations for illustrations:
The oldest linear regression channel is the blue unidirectional lines.
The smallest linear regression channel is the purple unidirectional lines.
CCI - the blue line in the indicator window.
Moving average (20; smoothed) - a blue line on the price chart.
Murray levels - multi-colored horizontal stripes.
Haiken Ashi is an indicator that colors bars in blue or purple.
Possible price movement options:
Red and green arrows.
The material has been provided by InstaForex Company - www.instaforex.com