
4-hour timeframe
Amplitude of the last 5 days (high-low): 49p - 42p - 59p - 55p - 49p.
Average volatility over the past 5 days: 51p (average).
The EUR/USD pair ends the second trading day of the week with a downward movement. Last night and this morning we talked about the general fundamental background remains in favor of the US currency. We mean the general background, and not individual macroeconomic reports. From our point of view, the euro has grown sufficiently at the end of last year, so now it is time to begin the formation of a new downward trend. Monday's macroeconomic reports, it can be said, pleased euro bulls. However, today, it seems that when the bulls could continue to develop their success, the bears seized the initiative, and we believe that they very reasonably seized it. As we have repeatedly said, the main advantage of the US dollar continues to be the strength of the American economy. The strength of the monetary policy of the Federal Reserve. Here, the euro, the EU economy and the ECB policy lose outright. But these factors are the main ones for investors and for traders. One has only to think and it becomes clear that neither the trade war with China, nor the case of the impeachment of Donald Trump, nor the military conflict with Iran did not exert due pressure on the US currency. Indeed, why should traders and big players get rid of the US dollar? Trump will not be removed from his post, since most of the senators are Republicans. Even if a miracle happens and the Senate decides to endorse the impeachment of the president, so what? A new president will be elected. Trade war with China? It has a negative impact on the US economy ... but also on the economy of the European Union, and the Chinese economy as well as many other countries of the world, which also depend on China and the United States. Military conflict with Iran? So far, Iran has not taken any retaliatory action, and if the US dollar fell every time threats were sent to Washington, then only replicas of the DPRK leader Kim Jong-un would be enough for the dollar to approach the level of two to one with the euro currency. In general, in the end, we believe that all of the topics listed above can have an impact on the US economy, on the world economy, but they have no impact on the US dollar specifically yet.
In the European Union, a report on retail sales in November was published today. Unexpectedly for many, this indicator showed an increase of 1.0% in monthly terms and 2.2% in annual terms. Predicted values were much lower. Pleased with the preliminary value of the consumer price index for December in the European Union, which fully coincided with experts' forecasts and amounted to 1.3% YOY. However, even at the time of publication of these data, the euro was no longer in demand among traders. Why? Because retail sales are not in themselves a strong indicator of the state of the economy. Because inflation coincided with the forecast and at the same time remains at a fairly low level. Because yesterday's indexes of business activity in the US manufacturing sector, which showed a positive trend, were completely ignored. Thus, we believe the resumption of the downward movement is absolutely justified.
Several macroeconomic reports have also been published in the United States today. Firstly, these are production orders for November, which fell by 0.7% MOM and turned out to be better than experts' forecasts. Secondly, the ISM index of business activity in the service sector for December was released, which amounted to 55.0, thus exceeding both the forecast value (54.5) and the previous one (53.9). Thus, in the afternoon, the US dollar had all the trump cards on hand and logically resumed strengthening.
Meanwhile, the conflict between the United States and Iran continues to erupt. During the funeral of Colonel Soleimani, who was killed on Trump's order, the local television announcer promised $80 million for Trump's head. It is difficult to say whether this was a personal initiative of the Iranian announcer, or whether the official award. We have already said that the Iranian government promised to "brutally take revenge" on Washington, and Trump promised to bomb 52 targets in Iran if Tehran inflicts any damage to the Americans or US objects.
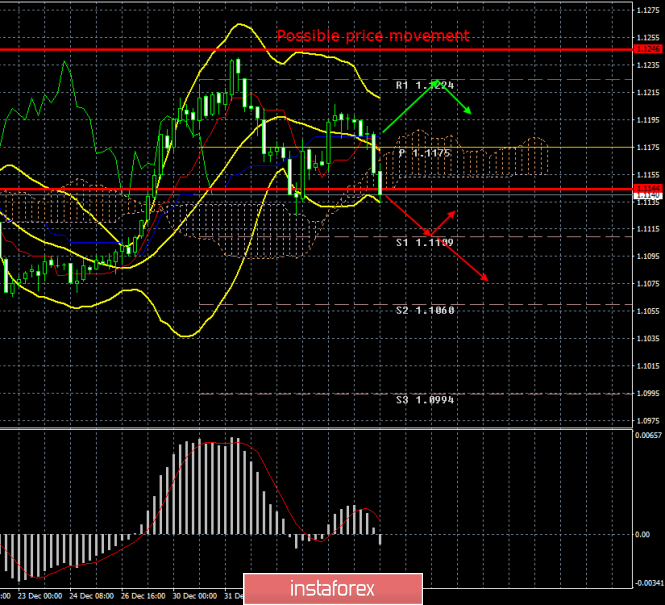
From a technical point of view, at the current bar, the euro/dollar pair has worked the Senkou Span B line and now it will either bounce off of it or overcome it. In the second case, the chances of continuing to sharply move down. Bollinger Bands turned down, like the MACD indicator, indicating the completion of a round of upward correction. The average volatility has slightly decreased, but the lower level of volatility of 1.1144, which we designated this morning, has already been successfully worked out.
Trading recommendations:
The EUR/USD pair resumed its downward movement. Thus, now it is recommended for traders to trade in lower lots for targets with the Senkou Span B line and the support level of 1.1109. It will be possible to consider purchases of the euro/dollar pair no earlier than when the price consolidates above the Kijun-sen critical line with the first target at the resistance level 1.1224.
Explanation of the illustration:
Ichimoku indicator:
Tenkan-sen is the red line.
Kijun-sen is the blue line.
Senkou Span A - light brown dotted line.
Senkou Span B - light purple dashed line.
Chikou Span - green line.
Bollinger Bands Indicator:
3 yellow lines.
MACD indicator:
Red line and bar graph with white bars in the indicators window.
Support / Resistance Classic Levels:
Red and gray dotted lines with price symbols.
Pivot Level:
Yellow solid line.
Volatility Support / Resistance Levels:
Gray dotted lines without price designations.
Possible price movement options:
Red and green arrows.
The material has been provided by InstaForex Company - www.instaforex.com