
4-hour timeframe
Amplitude of the last 5 days (high-low): 55p - 49p - 64p - 67p - 28p.
Average volatility over the past 5 days: 53p (average).
The last trading day of the week for the EUR/USD pair is an upward rollback, which, in principle, has been brewing for at least a day. The beginning of this pullback coincided with the publication of macroeconomic statistics in the United States, which, looking ahead, did not please investors in the US currency. At the same time, the US dollar lost some 25 points on the weak macroeconomic statistics from across the ocean, that is, very little, so the downward trend continues, as before, and the downward movement is most likely to resume after the correction is completed. In general, the pair's volatility in recent days has started to decline again, and the downward movement to slow down. Perhaps this is how the euro/dollar reacts when it comes close to two-year lows in the region of $1.09. About 200 points remain at this level at the moment. However, one way or another, the downward trend is still preserved, which means we expect the resumption of the downward movement.
Macroeconomic statistics were published in the United States on Friday. After the ADP report on the change in the number of employees in the private sector exceeded the forecast value, traders also expected to see strong Nonfarm. In practice, everything turned out the other way around. The actual number of newly created jobs outside agriculture was 145,000 with a forecast of 162,000. The average hourly wage was 2.9% YOY, while the forecast was +3.1% YOY, and the unemployment rate remained unchanged at 3.5%. We believe that the reaction of currency traders to published statistics was absolutely logical. It is a small pullback in favor of the euro that is the most justified reaction of traders. Firstly, the NonFarm Payrolls report did not fail, but only turned out to be slightly lower than the not-so-weak forecast. Secondly, a strong report from ADP shows that the state of the labor market remains high. Thirdly, the low unemployment rate, the weakest over the past 50 years, also testifies to this. Thus, there was nothing disappointing in this statistics package. Wages also increased by 2.9%, which traders regarded as a weak increase, but until November 2018, wage growth in America was constantly below 3% in annual terms. Therefore, a slight slowdown in wage growth at the end of 2019 is also not a sign of a slowdown in the economy. Thus, the general conclusion is that statistics from overseas did not please traders, but did not disappoint; The US dollar has retreated from its highs (lows for the EUR/USD pair) and this is quite enough to consider the processing of reports completed.
Meanwhile, it became known exactly what sanctions would be introduced by the United States against Iran as a result of attacks on US military bases in Iraq. Finance Minister Stephen Mnuchin said the restrictive measures will be aimed at 17 of the largest producers of steel, aluminum, copper and iron in Iran, at three companies in the Seychelles and China, as well as at one vessel that is "involved in the purchase and sale of Iranian metallurgical products" . In addition, the restrictions will apply to eight senior Iranian officials. In conclusion, Mnuchin said, President Donald Trump is about to sign a decree in the near future that aims to limit "additional sources of income used by the Iranian regime to finance and support its nuclear program, missile development, and terrorism." Donald Trump himself said that Iran was going to attack four American embassies, one of which was in Baghdad, and only the efforts of US drones that eliminated General Kassem Soleimani managed to prevent the attack. The US leader also said that no withdrawal of troops from Iraq is planned in the near future.
Next week, tentatively on Friday, the case of the impeachment of Donald Trump will be transferred to the Senate. This was stated by the speaker of the lower house of Congress, Nancy Pelosi. "I asked the chairman of the judicial committee, Jerry Nadler, to be ready to submit next week a resolution on the appointment of governors and the transfer of articles on impeachment to the Senate." Thus, at the end of next week, Senate proceedings will begin and they could for Trump's impeachment. In any case, this epic will be completed, and most likely the fact that Trump will retain his post.
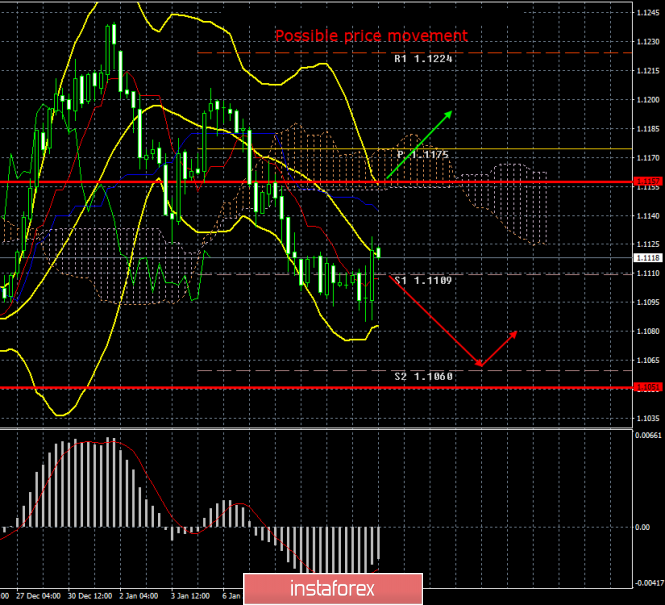
From a technical point of view, the EUR/USD currency pair started an upward correction, which was also signaled by a MACD upward reversal. Thus, the correction can continue while aiming for the critical Kijun-sen line, from which a rebound and the resumption of a new downward trend could follow. For the last two days, a pair of lateral movement has been observed, therefore, none of the levels of volatility has been worked out.
Trading recommendations:
The EUR/USD pair began to adjust. Thus, now it is recommended for traders to wait until the correction is completed and resume trading on the downside with the target support level of 1.1060. It will be possible to consider purchases of the euro/dollar pair not earlier than the traders of the Senkou Span B line with the first goal of 1.1224. All goals will be specified on Monday in the morning reviews.
Explanation of the illustration:
Ichimoku indicator:
Tenkan-sen is the red line.
Kijun-sen is the blue line.
Senkou Span A - light brown dotted line.
Senkou Span B - light purple dashed line.
Chikou Span - green line.
Bollinger Bands Indicator:
3 yellow lines.
MACD indicator:
Red line and bar graph with white bars in the indicators window.
Support / Resistance Classic Levels:
Red and gray dotted lines with price symbols.
Pivot Level:
Yellow solid line.
Volatility Support / Resistance Levels:
Gray dotted lines without price designations.
Possible price movement options:
Red and green arrows.
The material has been provided by InstaForex Company - www.instaforex.com