
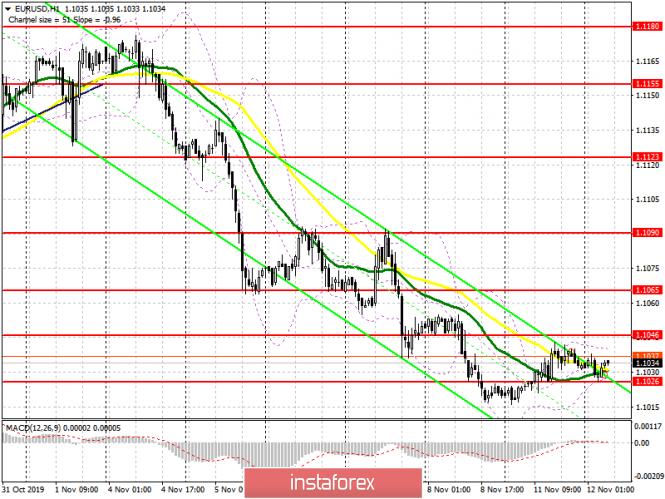
To open long positions on EURUSD you need:
Since yesterday, the technical picture in the EUR/USD pair has not changed. Euro buyers coped with the task and managed to maintain the support of 1.1025, and while trading is above this range, demand for the euro will continue. However, a more important task, in which the ZEW indices for Germany and the eurozone can provide help, will be a break of resistance at 1.1046 in order to reach highs 1.1046 and 1.1065, where I recommend profit taking. The formation of a false breakout in the support area of 1.1026, subject to a decrease in the euro there in the morning, will be another signal to open long positions. In the scenario of EUR/USD decline to the level of 1.1026, it is best to count on purchases after updating the lows of 1.0994 and 1.0969.
To open short positions on EURUSD you need:
The main task of sellers in the first half of the day is to return the pair to the support range of 1.1026, which could not be done today at the Asian session. Only this will keep EUR/USD in the bearish channel, which will lead to the updating of the lows 1.0994 and 1.0969, where I recommend profit taking. With continued upward correction and good data on Germany and the eurozone, the first active short positions can be observed in the resistance area of 1.1046, but selling from there is best only after the formation of a false breakout. Bigger sellers will prefer to return to the market only after a test of a high at 1.1065, from where it is possible to open short positions immediately for a rebound.
Signals of indicators:
Moving averages
Trade is conducted in the region of 30 and 50 moving average, which indicates the lateral nature of the market.
Bollinger bands
A break of the upper boundary of the indicator in the region of 1.1042 will strengthen the demand for the euro. A break of the lower boundary in the area of 1.1028 will lead to the formation of new pressure on the pair.
Description of indicators
- MA (moving average) 50 days - yellow
- MA (moving average) 30 days - green
- MACD: Fast EMA 12, Slow EMA 26, SMA 9
- Bollinger Bands 20