
4-hour timeframe
Amplitude of the last 5 days (high-low): 28p - 56p - 38p - 27p - 36p.
Average volatility over the past 5 days: 37p (low).
One of the most important indicators of the state of the foreign exchange market now is an indicator of volatility. For the EUR/USD pair, for example, it plunged to the low area and currently stands at 37 points a day. In the first two trading days of the week, such volatility was completely justified, since there were no important macroeconomic events during these days in either the United States or the European Union. Everything is logical. But today, when the calendar of macroeconomic publications was quite complete, traders showed the same disinterest in opening any positions. It is with this issue that we should deal with this article. Why is the market worth it?
First, a very brief look at all the publications of today and what they could provide to market participants. The first inflation to be published was in Germany. At the end of October, the consumer price index was +1.1% in annual terms and +0.1% in monthly terms. These were the predicted values and the previous values. Thus, the lack of reaction to this publication was not only because German inflation itself has a low degree of influence on the euro, but also because it did not surprise traders. In addition, industrial production in the eurozone for September was published, and here, at first glance, a surprise was even presented to traders, production increased by 0.1% as compared to the previous month, while experts predicted a decrease of 0.3% . In annual terms, the decrease was 1.7% with a forecast of -2.3%. However, if you look at the picture from the side, then such an "improvement" is simply a correction and nothing else. Industrial production consecutively fell for several months, now it is time for a correction. Thus, the downward trend in that indicator is not completely broken, and we can witness a new reduction in volumes already by the end of October. This was followed by the publication of the US consumer price index, and here the traders really had a reason to rejoice as inflation rose by 1.8% YOY in October, and again, thus, approaches the Federal Reserve's target level of 2.0% Most importantly, now we can assume that all the actions of the Fed lead to positive results in the form of accelerating inflation. Thus, this is an excellent "bell" for the US dollar, since now the Fed has even less reason for a new reduction in the key rate. This publication was somewhat overshadowed by the index of the consumer price index excluding food products and energy, which reached +2.3% YOY instead of the forecast +2.4% YOY. And after all these macroeconomic reports, the euro/dollar pair, in principle, remained at the same positions as it had before. Today, Jerome Powell is set to appear before the US Congress, however, given the current activity of market participants, it is unlikely that it will be able to move the pair from the place by more than 20-30 points.
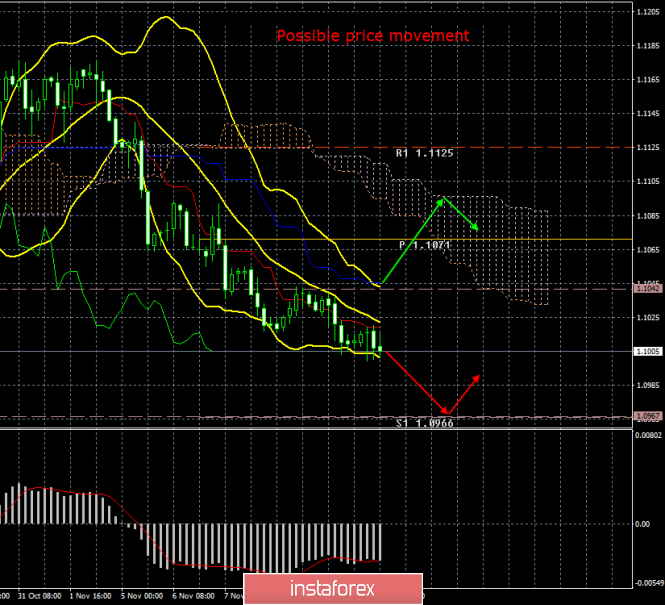
The most interesting thing is that the pair does not stand in one place in the literal sense of the word. The downward trend is visible to the naked eye. But volatility does not exceed 40 points a day. That is, the bears sell the euro little by little and buy dollars, but they do it with extremely small volumes, and the bulls cannot even oppose anything against such small volumes, since they are completely absent on the market. I believe that there is no need to explain why there are no bulls. There are no fundamental and technical reasons for the growth of the euro now. But why are bears so shy and what to expect in this regard from the currency pair? We believe that the pair has again come close to the lowest levels for two years, near which more good reasons are needed for new sales of the pair than weak inflation in Germany or accelerated in the US. Thus, a paradoxical situation arises when there seems to be nothing left but to sell the euro, but the market does not have sufficient reason to actively sell the pair near its two-year lows. What can Jerome Powell say tonight? Is the US economy "showing signs of recovery" or "in good condition"? That in the near future the Fed will not need to intervene in monetary policy? All this is already understandable. Thus, we believe that in the evening the situation for the pair will not change, and the downward movement, weakening in recent days, can completely "cool down" and be replaced by an upward correction. The technical picture shows that the downward movement is weakening. This moment is clearly visible on the Bollinger Bands indicator, which is narrowing. Nevertheless, the downward trend persists as long as the price falls below the Kijun-sen critical line.
Trading recommendations:
EUR/USD pair resumed the downward trend. Thus, now it is still recommended to sell the currency pair with the goal of the first support level of 1.0966. The MACD indicator now often turns up, but in most cases it is discharged, since the downward movement is extremely weak. It is recommended to return to purchases of the euro currency no earlier than the bulls crossing the Kijun-sen line, which is not expected in the near future.
Explanation of the illustration:
Ichimoku indicator:
Tenkan-sen is the red line.
Kijun-sen is the blue line.
Senkou Span A - light brown dotted line.
Senkou Span B - light purple dashed line.
Chikou Span - green line.
Bollinger Bands Indicator:
3 yellow lines.
MACD indicator:
Red line and bar graph with white bars in the indicator window.
Support / Resistance Classic Levels:
Red and gray dotted lines with price symbols.
Pivot Level:
Yellow solid line.
Volatility Support / Resistance Levels:
Gray dotted lines without price designations.
Possible price movement options:
Red and green arrows.
The material has been provided by InstaForex Company - www.instaforex.com