
Forecast for August 13:
Analytical review of currency pairs on the scale of H1:
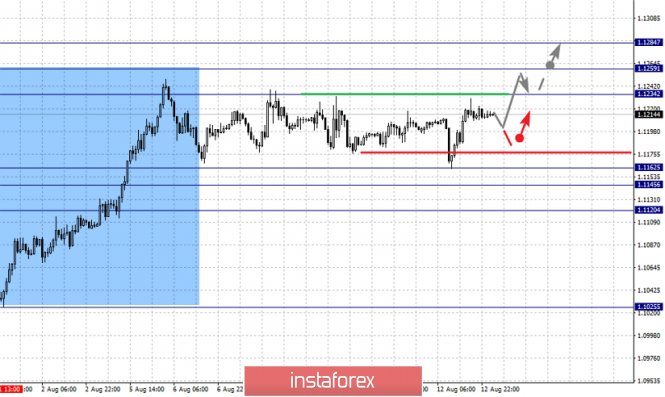
For the euro / dollar pair, the key levels on the H1 scale are: 1.1284, 1.1259, 1.1234, 1.1162, 1.1145 and 1.1120. Here, the price is in the correction zone from the medium-term ascending structure on August 1. The continuation of the upward trend is possible after the breakdown of the level of 1.1234. In this case, the target is 1.1259. For the potential value for the top, we consider the level of 1.1284. Upon reaching which, we expect consolidation, as well as a pullback to the bottom.
Short-term downward movement is possibly in the range of 1.1162 - 1.1145. The breakdown of the last value will lead to a long correction. Here, the goal is 1.1120. This level is a key support for the top.
The main trend is the medium-term upward structure from August 1, the correction stage.
Trading recommendations:
Buy 1.1234 Take profit: 1.1258
Buy 1.1261 Take profit: 1.1284
Sell: 1.1162 Take profit: 1.1146
Sell: 1.1144 Take profit: 1.1122
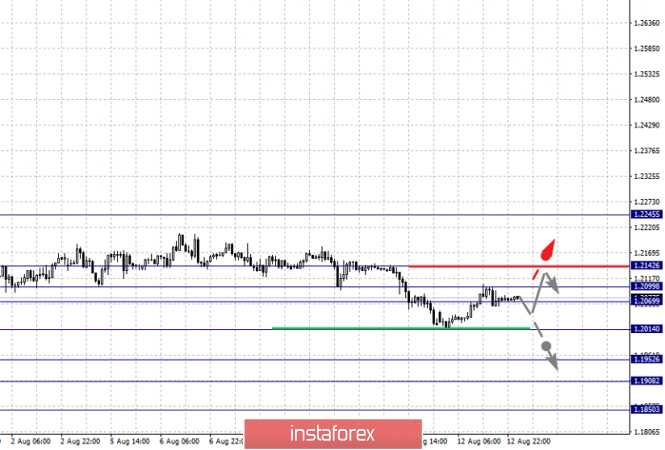
For the pound / dollar pair, the key levels on the H1 scale are: 1.2142, 1.2099, 1.2069, 1.2014, 1.1952, 1.1908 and 1.1850. Here, we follow the downward cycle of July 31. The continuation of the movement to the bottom is expected after the breakdown of the level of 1.2014. In this case, the target is 1.1952. Short-term downward movement, as well as consolidation is in the range of 1.1952 - 1.1908. For the potential value for the bottom, we consider the level of 1.1850. Upon reaching this level, we expect a pullback to the top.
Short-term upward movement is possibly in the range of 1.2069 - 1.2099. The breakdown of the last value will lead to a long correction. Here, the target is 1.2142. This level is a key support for the downward structure.
The main trend is the downward cycle of July 31.
Trading recommendations:
Buy: 1.2069 Take profit: 1.2097
Buy: 1.2100 Take profit: 1.2140
Sell: 1.2012 Take profit: 1.1954
Sell: 1.1950 Take profit: 1.1910
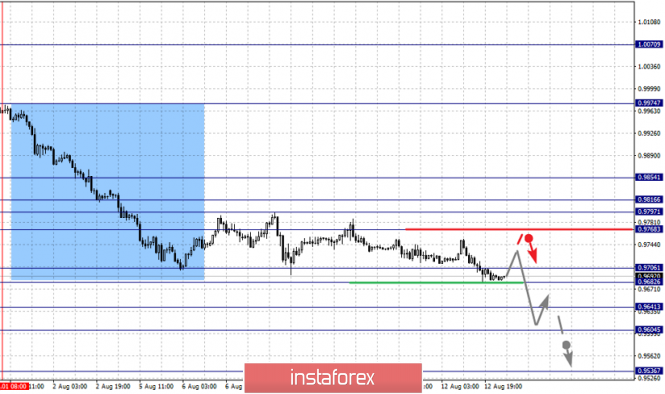
For the dollar / franc pair, the key levels on the H1 scale are: 0.9854, 0.9816, 0.9797, 0.9768, 0.9706, 0.9682, 0.9641, 0.9604 and 0.9536. Here, we follow the medium-term descending structure of August 1. The continuation of the movement to the bottom is expected after the price passes the noise range 0.9706 - 0.9682. In this case, the target is 0.9641. Short-term downward movement, as well as consolidation is in the range of 0.9641 - 0.9604. The breakdown of the level of 0.9604 should be accompanied by a pronounced downward movement. Here, the potential target is 0.9536.
The departure for correction is expected after the breakdown of the level of 0.9768. Here, the first goal is 0.9797. Short-term upward movement is possibly in the range of 0.9797 - 0.9816. The breakdown of the latter value will lead to the formation of initial conditions for the upward cycle. Here, the target is 0.9854.
The main trend is the descending structure of August 1.
Trading recommendations:
Buy : 0.9768 Take profit: 0.9797
Buy : 0.9818 Take profit: 0.9852
Sell: 0.9680 Take profit: 0.9641
Sell: 0.9638 Take profit: 0.9605
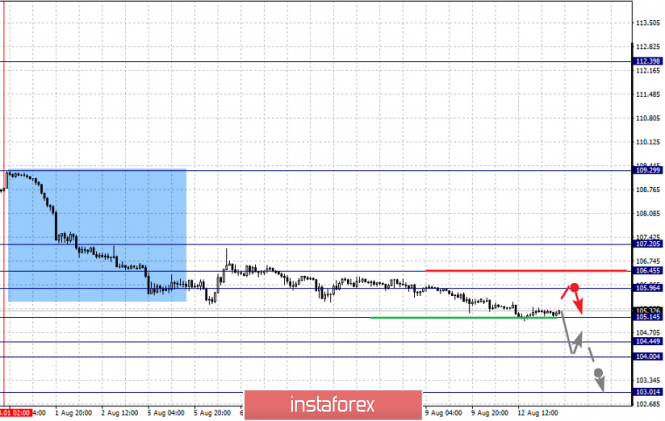
For the dollar / yen pair, the key levels on the scale are : 107.20, 106.45, 105.96, 105.14, 104.44, 104.00 and 103.01. Here, we follow the descending structure of August 1. The continuation of the movement to the bottom is expected after the breakdown of the level of 105.14. In this case, the target is 104.44. Price consolidation is in the range of 104.44 - 104.00. For the potential value for the bottom, we consider the level of 103.01. The movement to which is expected after the breakdown of the level of 104.00.
Short-term downward movement is possibly in the range of 105.96 - 106.45. The breakdown of the last value will lead to an in-depth correction. Here, the goal is 107.20. This level is a key support for the downward structure.
Main trend: descending structure of August 1.
Trading recommendations:
Buy: 105.96 Take profit: 106.43
Buy : 106.46 Take profit: 107.20
Sell: 105.13 Take profit: 104.46
Sell: 104.00 Take profit: 103.05
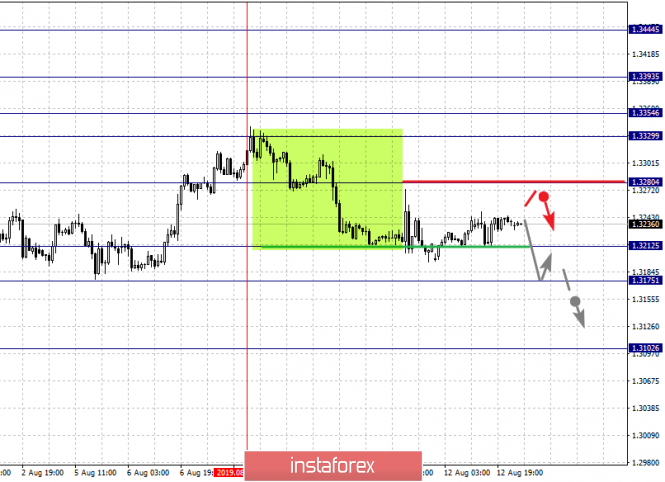
For the Canadian dollar / US dollar pair, the key levels on the H1 scale are: 1.3444, 1.3393, 1.3354, 1.3329, 1.3280, 1.3212, 1.3175 and 1.3102. Here, the price is in deep correction from the upward structure on July 31 and forms the potential for the downward movement from August 7. The breakdown of the level of 1.3212 will lead to the formation of expressed initial conditions for the downward cycle. In this case, the potential target is 1.3175. Price consolidation is near this level. The continuation of movement to the top is possible after the breakdown of the level of 1.3280. In this case, the first target is 1.3329. Consolidation is in the range of 1.3329 - 1.3354. The breakdown of the level of 1.3355 should be accompanied by a pronounced upward movement. Here, the target is 1.3393.
The main trend is the local ascending structure of July 31, the stage of deep correction.
Trading recommendations:
Buy: 1.3280 Take profit: 1.3329
Buy : 1.3355 Take profit: 1.3392
Sell: 1.3212 Take profit: 1.3178
Sell: 1.3173 Take profit: 1.3105
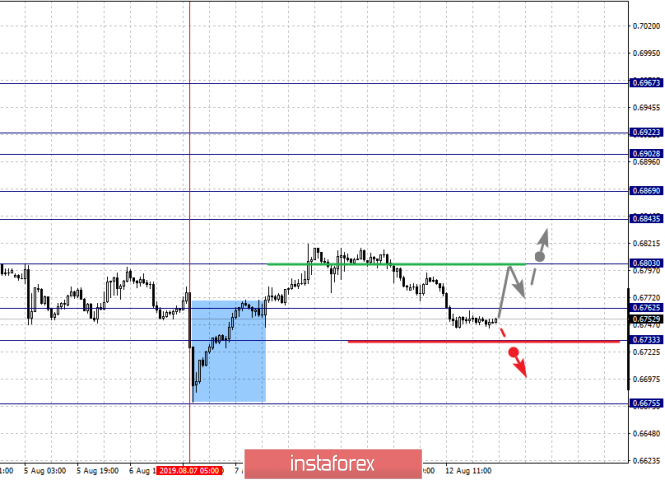
For the Australian dollar / US dollar pair, the key levels on the H1 scale are : 0.6967, 0.6922, 0.6902, 0.6869, 0.6843, 0.6803, 0.6762, 0.6733 and 0.6675.Here, we are following the development of the ascending structure from August 7. At the moment, the price is in deep correction. The development of this structure is is expected to be cancelled after the breakdown of the level of 0.6733. In this case, the potential target is 0.6675. The continuation of the upward movement is possible after the breakdown of the level of 0.6803. In this case the first target is 0.6843. Short-term upward movement, as well as consolidation is in the range of 0.6843 - 0.6869. The breakdown of the level of 0.6870 should be accompanied by a pronounced upward movement. Here, the target is 0.6902. Consolidation is in the range of 0.6902 - 0.6922. For the potential value for the top, we consider the level of 0.6967. Upon reaching which, we expect a pullback to the bottom.
The main trend is the formation of initial conditions for the ascending cycle of August 7, the stage of deep correction.
Trading recommendations:
Buy: 0.6805 Take profit: 0.6840
Buy: 0.6844 Take profit: 0.6867
Sell : 0.6730 Take profit : 0.6680
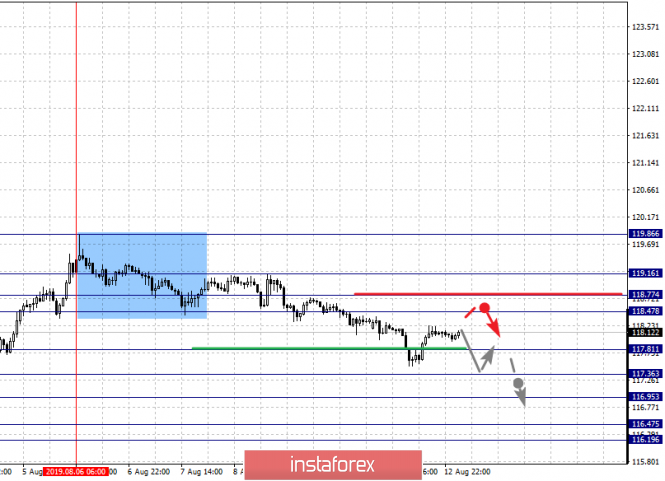
For the euro / yen pair, the key levels on the H1 scale are: 119.16, 118.77, 118.47, 117.81, 117.36, 116.95, 116.47 and 116.19. Here, we follow the descending structure of August 6th. The continuation of the movement to the bottom is expected after the breakdown of the level of 117.81. Here, the goal is 117.36. Short-term downward movement, as well as consolidation is in the range of 117.36 - 116.95. The breakdown of the level of 116.95 should be accompanied by a pronounced movement towards a potential target - 116.19. Consolidation is in the range of 116.47 - 116.19.
Short-term upward movement is possibly in the range of 118.47 - 118.77. The breakdown of the last value will lead to an in-depth correction. Here, the goal is 119.16. This level is the key support for the descending structure of August 6.
The main trend is the descending structure of August 6th.
Trading recommendations:
Buy: 118.48 Take profit: 118.75
Buy: 118.78 Take profit: 119.14
Sell: 117.80 Take profit: 117.38
Sell: 117.34 Take profit: 116.97
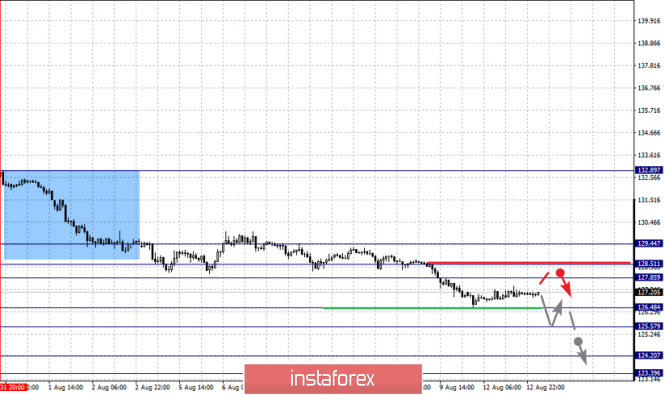
For the pound / yen pair, the key levels on the H1 scale are : 129.44, 128.51, 127.85, 126.48, 125.57, 124.20 and 123.39. Here, we follow the local descending structure of July 31. Short-term downward movement is expected in the range of 126.48 - 125.57. The breakdown of the last value should be accompanied by a pronounced downward movement, Here, the target is 124.20. For the potential value for the bottom, we consider the level of 123.39. Upon reaching which, we expect consolidation, as well as a rollback to the top.
Short-term upward movement is possibly in the range of 127.85 - 128.51. The breakdown of the last value will lead to a long correction. Here, the goal is 129.44. This level is a key support for the downward structure.
The main trend is the local descending structure of July 31.
Trading recommendations:
Buy: 127.85 Take profit: 128.50
Buy: 128.53 Take profit: 129.42
Sell: 126.45 Take profit: 125.58
Sell: 125.53 Take profit: 124.25
The material has been provided by InstaForex Company - www.instaforex.com