
4-hour timeframe
Amplitude of the last 5 days (high-low): 110p - 82p - 63p - 59p - 69p.
Average amplitude over the last 5 days: 77p (72p).
The EUR/USD pair ended the first trading day of the week, August 12, calmly without sudden movements, without amazing news and in continuation of the flat. Not a single important macroeconomic report was published during the day, however, the pair still tried to start a new downward trend, but failed. However, the US currency is still inclined towards a new strengthening, despite the fact that on Monday the market again reiterated concerns about the US-Chinese trade conflict. The thing is that the Goldman Sachs banking group has predicted its own version of the development of events in the trade war between Beijing and Washington. According to the bank, a trade agreement between the countries will not be concluded until the presidential election of 2020, since the recent mutual measures of Trump and Xi Jinping indicate an escalation of the conflict, and not a movement to overcome it. Goldman Sachs lowered its forecast for US GDP for the 4th quarter, and also warned that a trade war could lead to a recession in the United States. In addition, the IMF published a report calling on parties (China and the United States) to close a deal to avoid negative consequences for the global financial system. As you can see, many of the largest organizations are very worried about the trade war, but we are only interested in the context of the dollar exchange rate in the forex currency market. But in reality, the US currency does not yet feel much pressure, in this regard. Yes, in recent weeks, the US currency has slightly dropped, but still remains around the lows of the last two years. Demand for the euro is low.
Trading recommendations:
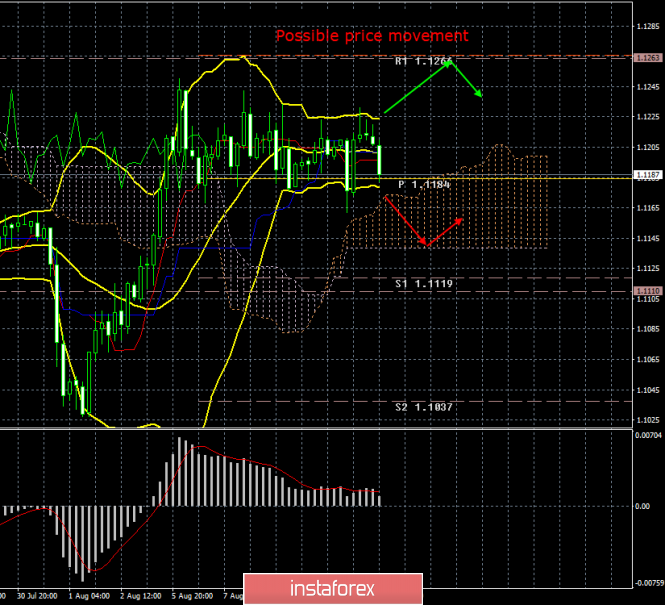
The EUR/USD pair continues its side correction, which is eloquently signaled by Bollinger bands. Thus, we recommend buying the euro/dollar pair not earlier than expanding the bands up with the first target of 1.1266. It is recommended to sell the pair in small lots after the reversal of the bands down to the Senkou span B line.
In addition to the technical picture, fundamental data and the time of their release should also be taken into account.
Explanation of the illustration:
Ichimoku indicator:
Tenkan-sen is the red line.
Kijun-sen is the blue line.
Senkou Span A - light brown dotted line.
Senkou Span B - light purple dashed line.
Chikou Span - green line.
Bollinger Bands Indicator:
3 yellow lines.
MACD indicator:
Red line and bar graph with white bars in the indicator window.
The material has been provided by InstaForex Company - www.instaforex.com