
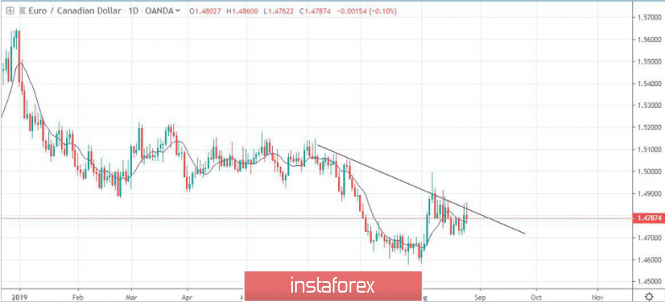
The above picture is the daily chart of EURCAD. We have plotted the moving average line using a blue line. Besides, the trend line is plotted using a black line. According to conventional technical analysis, the price is seen to be reacting every time it is touching the black line. It is in the process of forming a triangle pattern. From the definition of a downtrend, the price has made a lower high and may make a lower low. The price has reacted a couple of times from the support area, located near the low. Now that the price has fairly reacted form the trend line, it can be a good opportunity for traders who want to sell. Your target will be the recent low and stop-loss can be placed above the black trend line. If the price trades below the moving average line, then you can expect a lower low. This can result in a good risk-to-reward trade.
On the other hand, if the price is above the moving average, you should be inclined to buy. Based on your risk-taking ability, you could take either side of the trade. To reduce your risk, we suggest you rather sell than buy. It may take some time for clear buy signals with the possibility that the price can break out out even now. We advise you not to chase the price.
The material has been provided by InstaForex Company - www.instaforex.com