
To open long positions on GBP/USD you need:
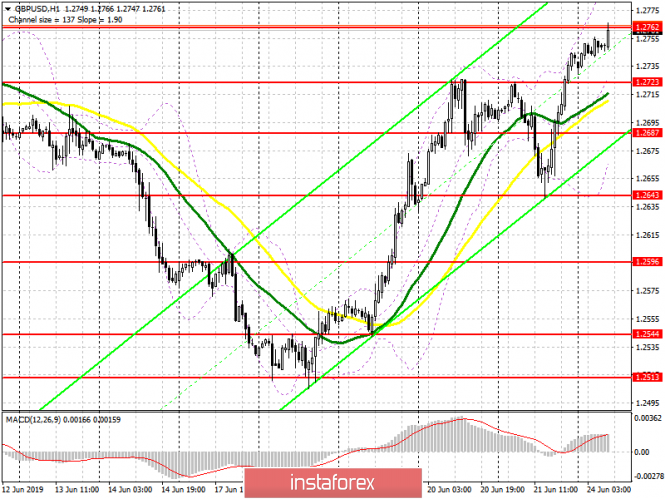
A weak US dollar renewed the demand for the pound and pulled it to the highs of this month. The goal of the bulls is a major resistance of 1.2762, a breakthrough of which will provide good support to buyers, which will lead to a renewal of highs around 1.2800 and 1.2860, where I recommend taking profits. With a downward correction scenario, and this is more likely in the first half of the day, long positions in the pound can be viewed at a false breakdown from support 1.2723 or at a rebound from a low of 1.2687, where the lower limit of the ascending channel passes.
To open short positions on GBP/USD you need:
Pound sellers will try to keep the pair above the resistance of 1.2762, and the formation of a false breakout there will be a direct signal to open short positions against the trend based on a small downward correction to the support area of 1.2723 and 1.2687, where I recommend to take profit. However, more interesting levels for selling GBP/USD today are seen at highs of 1.2799 and 1.2858.
Indicator signals:
Moving averages
Trading is above 30 and 50 moving averages, which indicates the bullish nature of the market.
Bollinger bands
In case the pound decreases, support will be provided by the lower boundary of the indicator in the area of 1.2687, while a breakthrough of the upper boundary in the area of 1.2775 will lead to the continuation of the upward trend.
Description of indicators
- MA (moving average) 50 days - yellow
- MA (moving average) 30 days - green
- MACD: fast EMA 12, slow EMA 26, SMA 9
- Bollinger Bands 20