
To open long positions on GBP / USD you need:
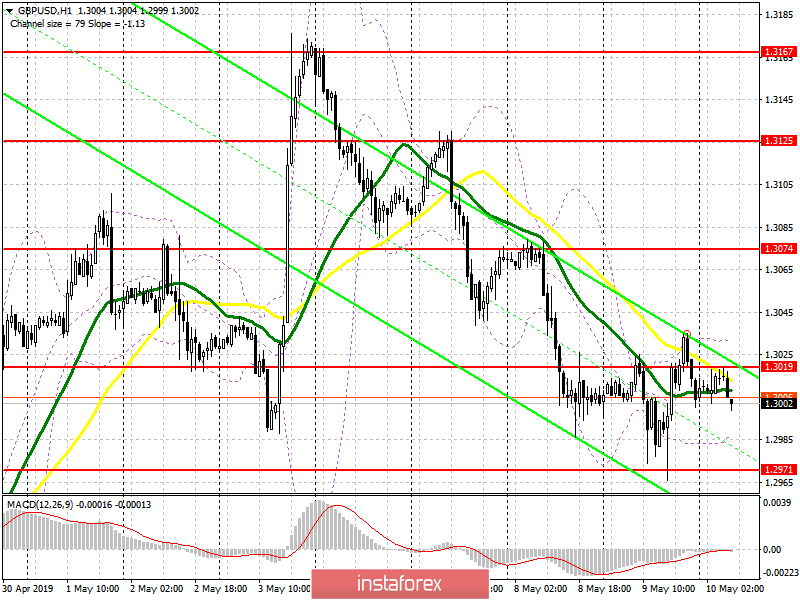
Yesterday, buyers managed to stop the pound's downward movement after the divergence on the MACD indicator, which I talked about in more detail in my reviews. At the moment, the task of the bulls is the resistance of 1.3020, the breakthrough of which will form a new, larger upward wave with a test of highs of 1.3074 and 1.3125, where I recommend taking profits. However, as you can understand, everything will depend on UK GDP data, which is published in the morning. In case the GBP/USD declines, long positions can be seen at a false breakdown in the support area of 1.2971 or at a rebound from a low of 1.2933.
To open short positions on GBP/USD you need:
The formation of a false breakdown in the resistance area of 1.3019 will be an excellent signal for opening short positions in the pound, and the weak data on UK GDP will quickly pull down the pair to the support area of 1.2971 and 1.2933, where I recommend taking profits. When the growth scenario is above 1.3019, and a good economic report, it is best to sell after forming a false breakdown in the resistance area of 1.3074 or for a rebound from a high of 1.3125.
Indicator signals:
Moving averages
Trading takes place at around 30 and 50 moving averages, which indicates market uncertainty over important data.
Bollinger bands
The indicator volatility is very low, which does not give signals for entering the market.
Description of indicators
- MA (moving average) 50 days - yellow
- MA (moving average) 30 days - green
- MACD: fast EMA 12, slow EMA 26, SMA 9
- Bollinger Bands 20