
Gold price has broken below $1,300 since last week and is showing weakness signs. Price tried to bounce on Friday towards $1,300 but bulls were unable to recapture the resistance level. This rejection at $1,300 is a bearish sign opening the way for a move towards $1,260-50.
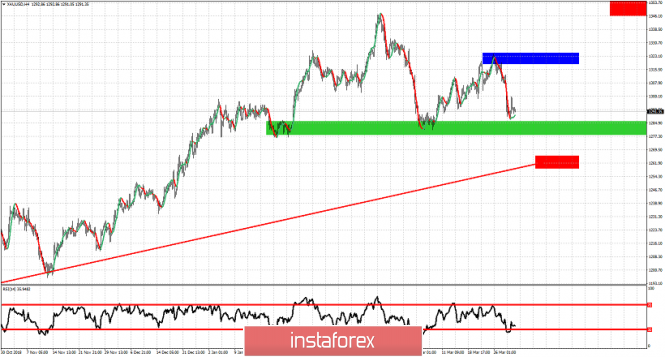
Green rectangle -major support
Blue rectangle - major resistance
Red line - long-term upward sloping trend line
Gold price is trading near last weeks lows. Price is still below $1,300 and is challenging support at $1,290. The $1,280-90 area is very important support and if broken will lead Gold price to further losses towards $1,260-50 and the lower red rectangle. If support is respected, Gold price could start a bounce or even a new upward move. Resistance at $1,324.50 is important an if broken Gold would move towards $1,350-60.
The material has been provided by InstaForex Company - www.instaforex.com