
To open long positions on EURUSD you need:
European Central Bank President Mario Draghi's statements were negatively perceived by the market, which caused the euro to fall in the afternoon, but then buyers were able to compensate for losses in a similar report from the US Federal Reserve. Today it is best to rely on new purchases after forming a false breakdown in the support area of 1.1260, which will lead to an update of this week's high in the area of 1.1287. However, only a breakthrough will form a new uptrend, making it possible to update levels 1.1324 and 1.1358, where I recommend taking profits. In case the euro declines in the first half of the day below the support of 1.1260, it is best to consider new long positions for a rebound from a large low in the area of 1.1232 and 1.1183.
To open short positions on EURUSD you need:
In the first half of the day, sellers can show themselves only after the formation of a false breakdown in the resistance area of 1.1287, which will lead to renewed pressure on the euro and a decrease in the support area of 1.1260. However, the main task of sellers will be a breakthrough of this level with a test of the low in the region of 1.1232 and 1.1183, where I recommend taking profits. When the EUR/USD growth scenario is above 1.1287 in the first half of the day, it is best to consider short positions on a rebound from a high of 1.1324.
Indicator signals:
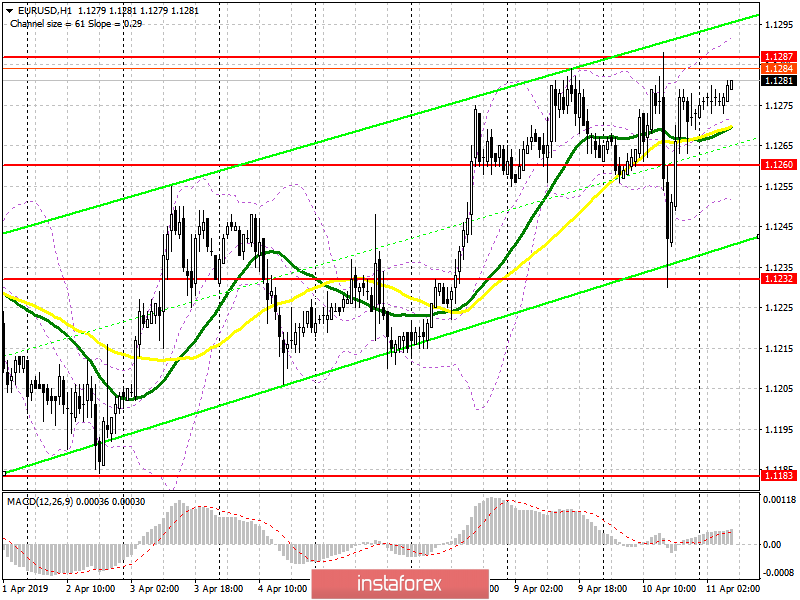
Moving averages
Trade is conducted in the region of 30 and 50 moving averages, which indicates market uncertainty.
Bollinger bands
Only a break through the upper border of the Bollinger Bands indicator in the area of 1.1292 will lead to a revival of an uptrend.
Description of indicators
- MA (moving average) 50 days - yellow
- MA (moving average) 30 days - green
- MACD: fast EMA 12, slow EMA 26, SMA 9
- Bollinger Bands 20