
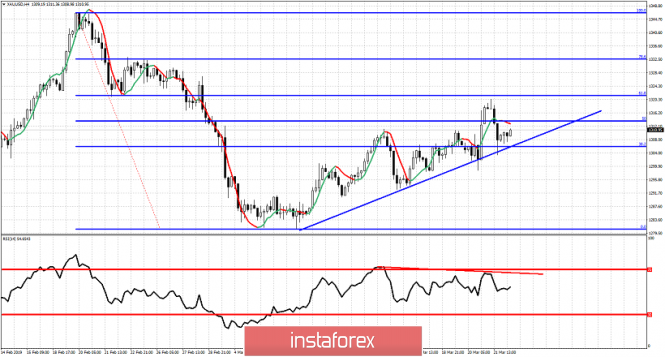
Gold price remains in a short-term bullish trend from early March and the $1,280 area. Price continues to make higher highs and higher lows reaching yesterday important Fibonacci resistance and getting rejected.
Red line - bearish divergence
Gold price continues to trade above $1,300 and this in favor of the bulls. Price continues to make higher highs and higher lows and this is also in favor of the bulls. Bulls want to continue to see price above the blue trend line support and break above the 61.8% Fibonacci retracement resistance where it got rejected yesterday. Bears on the other hand since $1,280-90 were warned for a possible bounce towards $1,310-20 area. This has unfolded and price got rejected at the Fibonacci resistance. Bears now want to see price break the blue trend line support at $1,304-5. A weekly close towards $1,300 or even better below it would be ideal for bears. Gold price is near important Fibonacci resistance. I prefer to stay neutral at current levels because the price has risen more than $40 in the last month and there is a danger of a bearish reversal from current resistance.
The material has been provided by InstaForex Company - www.instaforex.com