
Gold price did not break below $1,300 yesterday and with Dollar weakness has broken above short-term resistance at $1,312. Price is closing in on our first target and important Fibonacci resistance at $1,322.
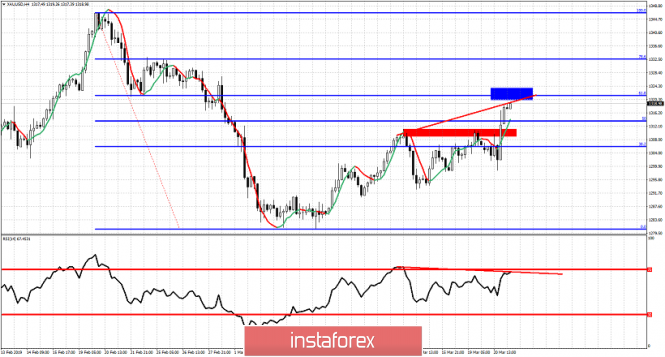
Red rectangle- short-term resistance (broken)
Blue rectangle - short-term target
Gold price is trading very close to our target of 61.8% Fibonacci retracement. We warned that a break above $1,312 would open the way for a move towards $1,322. Despite the new high in price, the RSI did not follow. This is a bearish divergence. This is just a warning and not a reversal signal. Key support is now found at $1.301-$1,298. A four-hour close below this level will most probably push Gold price below $1,280-70. As long as price is above $1,300 bulls remain in control of the short-term trend. $1,332 is also another major resistance. Breaking above it will open the way for a push towards $1,350-60.
The material has been provided by InstaForex Company - www.instaforex.com