
To open long positions on GBP/USD you need:
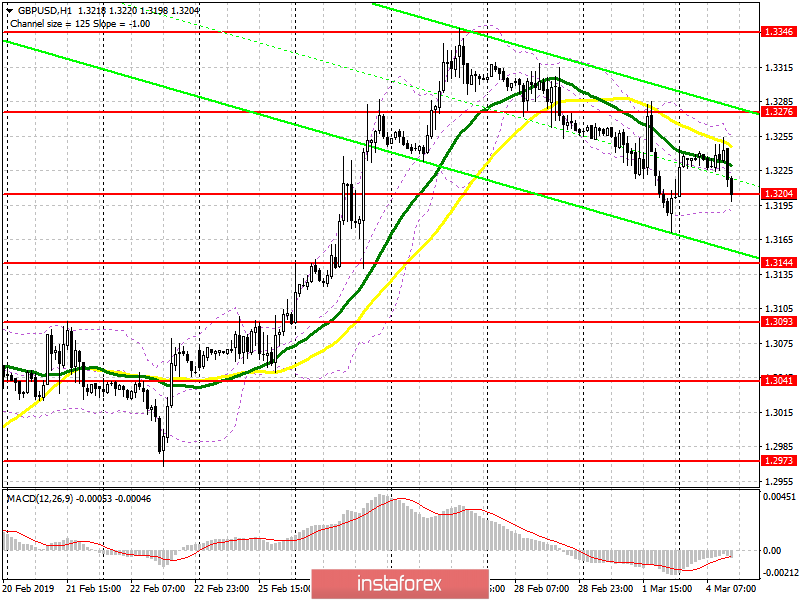
Buyers are trying to form a false breakdown in the support area of 1.3204, which I paid attention to in my morning review. However, it is best to open larger long positions to rebound from a low of 1.3144. The main task of the bulls is the return and breakthrough of resistance at 1.3276, which will lead the pound to new highs in the area of 1.3346 and 1.3386, where I recommend to lock in profits.
To open short positions on GBP/USD you need:
An unsuccessful attempt at growth in the area of a resistance of 1.3276 in the first half of the day was a clear signal to sell the pound. The main task for the second half of the day is to consolidate below the support of 1.3204, which will lead to a larger sale to the area of a low of 1.3144, where I recommend taking profits. In case the GBP/USD increases, short positions can be opened immediately to rebound from a high of 1.3276 and a larger resistance area of 1.3346.
Indicator signals:
Moving averages
Trade is conducted below the 30-day and 50-medium moving averages, which indicates a bearish market correction.
Bollinger bands
The volatility of the Bollinger Bands indicator is very low, which does not give signals on entering the market.
Description of indicators
- MA (moving average) 50 days - yellow
- MA (moving average) 30 days - green
- MACD: fast EMA 12, slow EMA 26, SMA 9
- Bollinger Bands 20