
To open long positions on EURUSD you need:
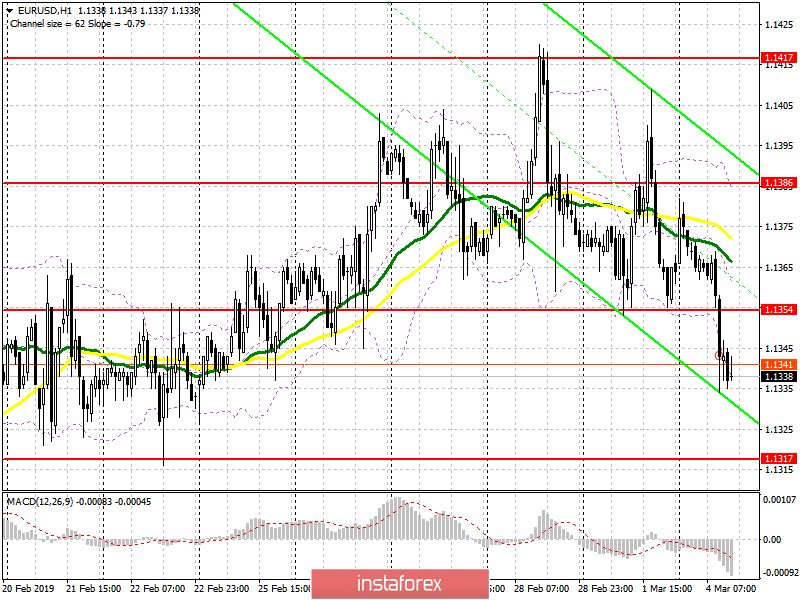
Euro buyers did not manage to stay above the support of 1.1354 in the first half of the day, as a result of which the pair continued its decline. At the moment, it is best to return to long positions to rebound from a large level of 1.1317, to which EUR/USD is currently aiming for. However, the main task for the second half of the day will be a return and consolidation above the resistance of 1.1354, which will lead to a larger upward correction in the area of 1.1386, where I recommend taking profits.
To open short positions on EURUSD you need:
Eurozone producer prices coincided with the expectations of economists, which led to a further downward correction and the breakdown of support at 1.1354. As long as trading will be conducted below this range, pressure on the euro will continue, and in case of an upward correction, the formation of a false breakdown on this range will be an additional signal to sell EUR/USD with a target of 1.1317, where I recommend taking profits today. If the growth scenario is higher than the resistance of 1.1354, you can sell the euro to rebound from the level of 1.1386.
Indicator signals:
Moving averages
Trade remains below the 30-day and 50-medium moving averages, indicating a bearish nature of the market.
Bollinger bands
The breakout of the lower limit of the Bollinger Bands indicator led to a new wave in selling the euro. In the afternoon, growth may be limited by the average indicator limit in the area of 1.1360.
Description of indicators
- MA (moving average) 50 days - yellow
- MA (moving average) 30 days - green
- MACD: fast EMA 12, slow EMA 26, SMA 9
- Bollinger Bands 20