
To open long positions on EURUSD you need:
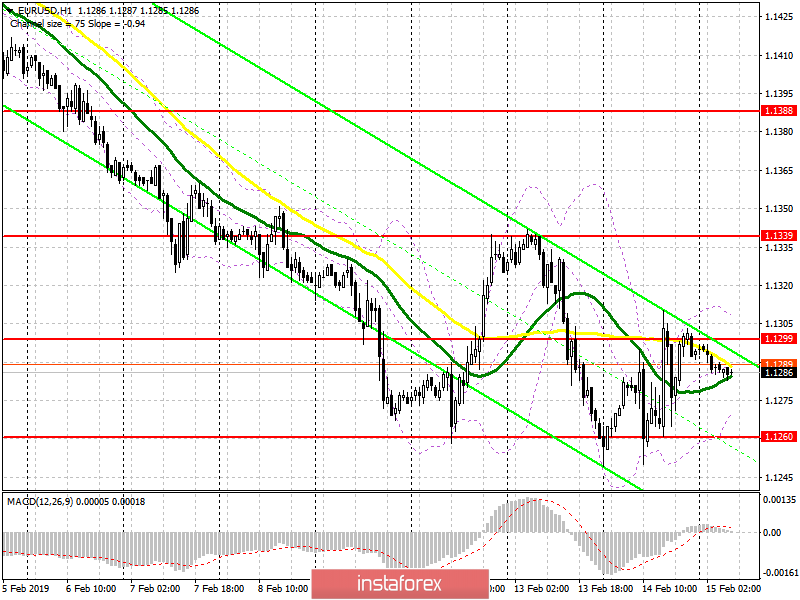
The euro recovered yesterday following the release of weak US statistics, the next series of which is scheduled for the afternoon today. Currently, euro buyers need a breakthrough and consolidation above the middle of the side channel of 1.1299, which will lead to an increase in long positions with an update of the upper limit of 1.1339, where I recommend taking profits. The main target will be a high of 1.1388. If the data on the eurozone manages to disappoint investors once again, it is best to return to long positions on a false breakdown around 1.1260 or on a rebound from the new monthly low of 1.1215.
To open short positions on EURUSD you need:
Bears can return to the market after the formation of a false breakdown in the area of resistance at 1.1299, and the main task for the first half of the day will be a breakthrough of support of 1.1260, below which a large sale will lead to a test of a low of 1.1215 and 1.1180, where I recommend taking profits. Sellers may receive some support following the release of weak data for the euro area, but the main movement will be based on US economic indicators. In case the EUR/USD grows above the resistance of 1.1299, I recommend returning to short positions on a rebound from a high of 1.1339.
Indicator signals:
Moving averages
Trade is conducted in close proximity to about 30-day and 50-day moving averages, which indicates the formation of the lateral nature of the market.
Bollinger bands
Bollinger Bands indicator volatility is very low, which does not give signals on market entry.
Description of indicators
- MA (moving average) 50 days - yellow
- MA (moving average) 30 days - green
- MACD: fast EMA 12, slow EMA 26, SMA 9
- Bollinger Bands 20