
Gold price remains in a bullish trend. Price made a shallow pullback yesterday from $1,288 to $1,278 and then continued to make a new higher high. There are some bearish divergence signs in the 4-hour chart but not on the Daily chart. Gold could soon make a deeper pullback but the uptrend has not finished yet.
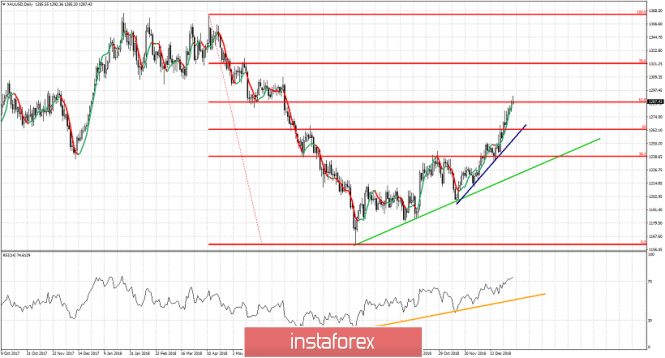
Blue line - short-term trend line support
Green line - major trend line support
Gold price is now trading above the 61.8% Fibonacci retracement. As long as price is above yesterday's lows, we will be expecting $1,300 to be reached. If yesterday's low at $1,278 is broken I would expect Gold price to move towards the blue trend line support and towards $1,270-65 area. There is no sign of weakening the uptrend. So far all pullbacks are considered buying opportunities.
The material has been provided by InstaForex Company - www.instaforex.com