
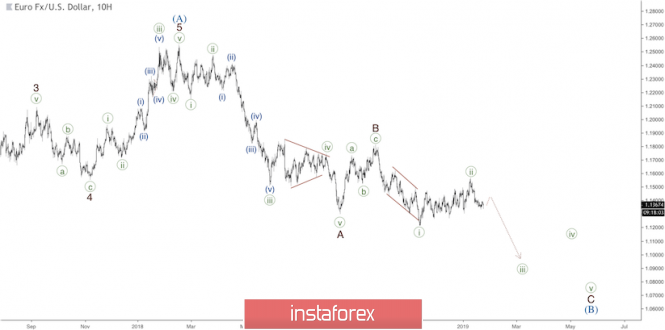
It's likely that wave (B) is taking the form of a double zigzag, as shown on the 10-hour chart. There're a finished impulse in wave A and a zigzag in wave B, so now an impulsive decline in wave C of (B) is taking place. In this case, after a short break, we're going to have the rest of the third wave of wave C, which means the low of wave ((i)) will be broken in the coming days.
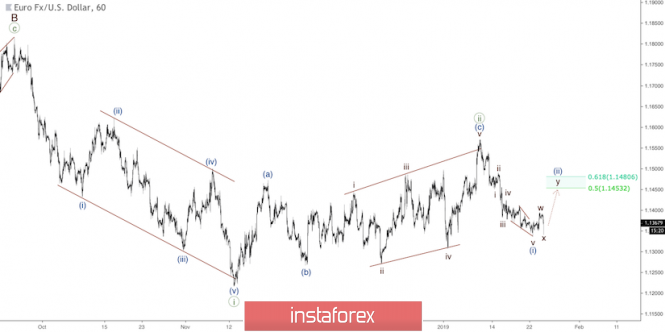
As we can see on the one-hour chart, wave ((i)) has arrived as a leading diagonal pattern, which
led to an upward correction. After a few weeks of consolidation, wave ((ii)) ended as a zigzag
with an ending diagonal in wave (c). A pullback from the upper side of this pattern turned out to
a decline, so there's a downward impulse wave, which could be the first wave of wave ((iii)).
The fifth wave of wave (i) has ended as an ending diagonal. That's why the following upward
three-wave price movement could be the first step into wave (ii). This correction is probably
taking the form of a double zigzag, which is going to move on during the day. Thus, we should
keep an eye on the 0.5 retracement level at 1.1453 as the nearest bullish target.
Meanwhile, if the price goes through this level, there'll be a moment for longer wave (ii). Also,
it's possible to have wave ((i)) as a flat pattern because of zigzags in waves w and x. The only
difference between two scenarios is what we'll have in the upcoming bullish wave. If we have a
double zigzag in wave (ii), as shown on the chart above, the price will develop a zigzag in wave
y of (ii). However, if we face with a flat pattern, then we could have an impulse in wave c of (ii).
Well, the hour is nearly upon us.
The material has been provided by InstaForex Company - www.instaforex.com