
To open long positions on EURUSD you need:
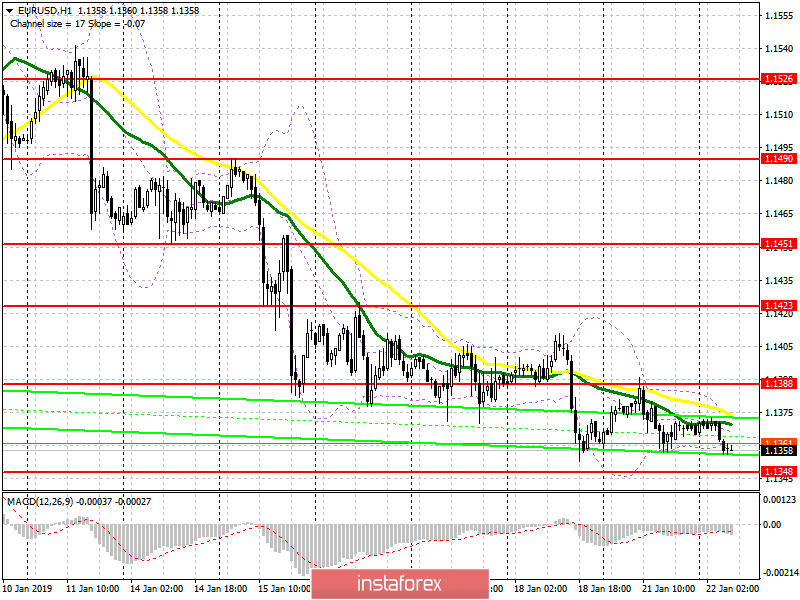
The absence of important fundamental statistics and weak data for the eurozone yesterday led to selling the European currency. At present, the first signal to buy the EUR/USD will be a breakdown and consolidation above the resistance level of 1.1388, which will lead to a larger upward correction in the area of a high of 1.1423, where I recommend taking profits. The formation of a false breakdown in the support area of 1.1348 will also be the reason for buying the European currency. Otherwise, it is best to open long positions to rebound from this year's low around 1.1312.
To open short positions on EURUSD you need:
Weak data on sentiment in the business environment of the eurozone, which is expected today in the first half of the day, can help sellers break below support level 1.1348, which will lead to a larger sale of EUR/USD with a low of 1.1312, where I recommend to fix profits. Under the euro growth scenario after the report, it is best to return to short positions, provided that a false breakdown is formed in the resistance area of 1.1388. Otherwise, I recommend opening short positions on a rebound from the upper border of the lateral channel of the previous week in the area of 1.1423.
Indicator signals:
Moving averages
Trading remains below the 30-day and 50-day moving averages, which indicates the bearish nature of the market.
Bollinger bands
The volatility of the Bollinger Bands indicator is low, which does not give signals to enter the market.
Description of indicators
- MA (moving average) 50 days - yellow
- MA (moving average) 30 days - green
- MACD: fast EMA 12, slow EMA 26, SMA 9
- Bollinger Bands 20