
Technical outlook:
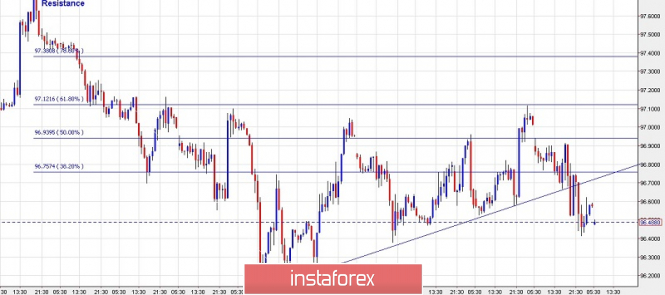
An hourly chart has been depicted here to have a short-term trading setup and outlook for US Dollar Index. Please note that the US Dollar Index had raised to the 97.10 levels, hitting resistance at the Fibonacci 0.618 levels and reversing sharply yesterday. Furthermore, it has also broken below its counter trend line support and the prices are trading lower around the 96.48 levels, respectively. For any intraday short-term rallies, the levels of 96.80/90 could provide strong resistance and, ideally, the prices should remain well capped below the 97.10 levels. On the other side, if the prices manage to break higher, the Fibonacci 0.786 resistance may be tested at the 97.40 levels. The critical figure for bears in order to remain in control is the 97.71 level.
Trading plan:
Remain short, stop at 97.71, target 95.00
Good luck!
The material has been provided by InstaForex Company - www.instaforex.com