
Technical outlook:
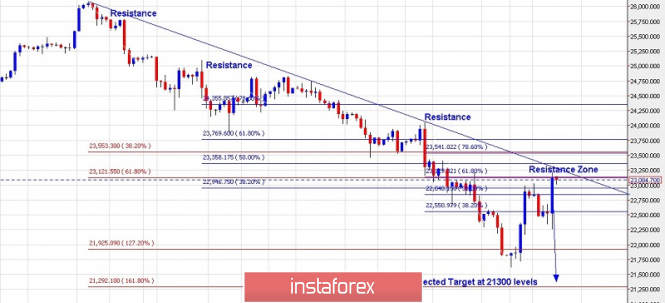
The 4H chart has been presented here for the medium-term analysis of Dow Jones Industrial Average. As discussed yesterday, the Dow Jones index rallied close to the 23,200 levels as seen on the chart. Please note that the index is trading very close to the resistance trend line and the Fibonacci resistance confluences with the 23,200/300 mark. Also note that the next Fibonacci target is seen towards the 21,300 levels as projected here. Immediate price resistance is seen at 24,000, while interim support is seen at the 21,800 levels, respectively. Ideally, the prices should remain below the 24,000 resistance and resume towards its downside target at the 21,300 levels. Please watch out for a bearish reaction around the levels of 23,200/300 in order to initiate short positions again.
Trading plan:
Short from 23200, stop at 24000, target 21300
Good luck!
The material has been provided by InstaForex Company - www.instaforex.com