
Gold price has made a new higher high yesterday but price is still stuck around the 38% Fibonacci retracement level. Price is challenging the short-term bullish channel. Trend remains bullish but a break below $1,220 would bring bears back in the game.
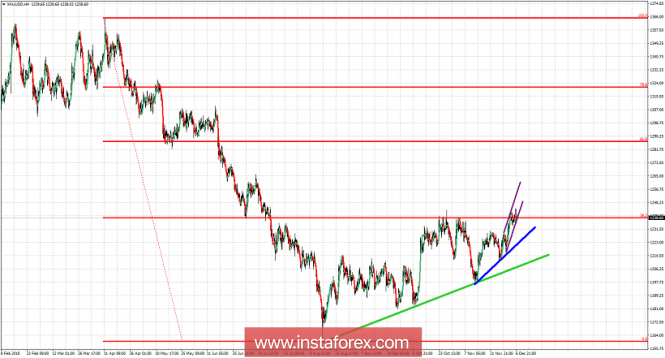
Green line - major trend line support
Blue line - short-term trend line support
So far price is making higher highs and higher lows. As long as price is above the blue trend line support, we target $1,250-60 area. Bulls remain in control of the trend as long as price is above the green trend line. Breaking below this trend line would be a very bearish sign. Any pull back towards $1,225-30 is considered a buying opportunity with stops at $1,220-19 area. The 61.8% Fibonacci retracement level is an important target if bulls manage to stay above the 38% Fibonacci level.
The material has been provided by InstaForex Company - www.instaforex.com