
4-hour timeframe
The amplitude of the last 5 days (high-low): 53p - 94p - 61p - 101p - 50p.
Average amplitude for the last 5 days: 72p (86p).
The EUR/USD currency pair on Thursday, December 6, in the first half of the day again showed a corrective upward movement, again weak and again within a downward trend. The first set of macroeconomic statistics from America disappointed traders. The ADP report on private sector employment was worse than expected, the trade deficit exceeded the forecast, and the number of applications for unemployment benefits was higher than market expectations. Individually, these reports might not have triggered a strengthening of the auro. But three consecutive weak jobs report caused the sell-off of the dollar. However, at the moment it is too early to say that an uptrend is emerging. So far, the pair has worked the critical Kijun-sen line and has not yet consolidated above it. If this happens, we can expect the upward movement to continue. However, we warn that the pair has overcome the Kijun-sen at least twice in the last days, and each time very quickly completed the upward movement. Something like this could happen this time. Stability, as well as certainty, is now in the market a bit. There are no new data on the trade war between China and the United States, Brexit or the budget problem in Italy. Therefore, traders cannot decide what kind of medium-term positions to open. And intraday positions are displayed on the chart in the form of a flat and sharp and frequent turns in different directions.
Trading recommendations:
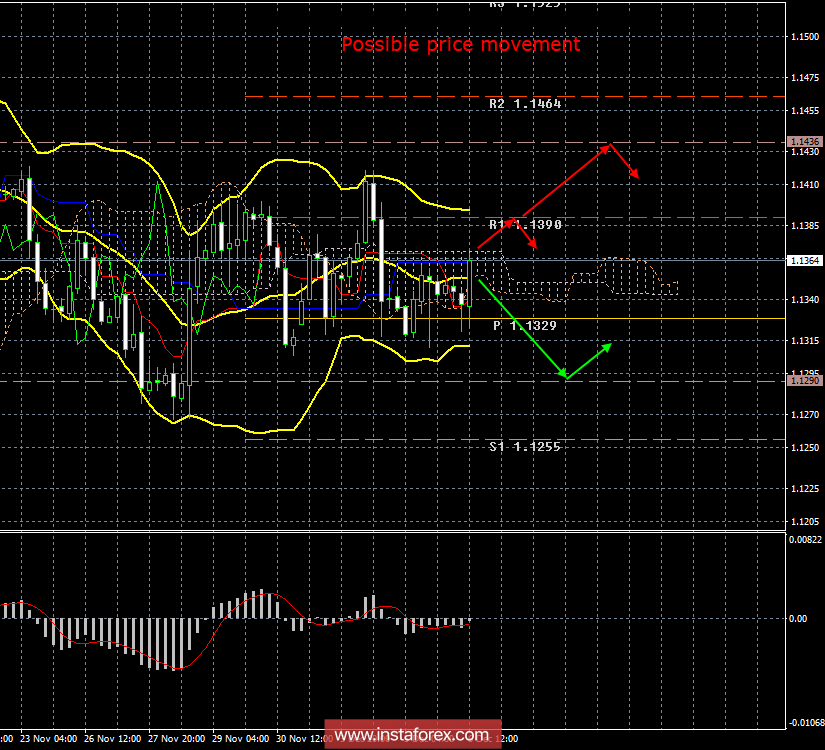
The EUR/USD pair continues to adjust, but it cannot consolidate above the critical line. Therefore, we wait for the completion of the correction and consolidation of the price below the Ichimoku cloud. The goal is 1,1290. Now there is a high probability of flat.
Buy orders are recommended to open in case of overcoming the line Senkou Span B with targets 1.1390 and 1.1436. But even in this case, the upward movement may end near the upper Bollinger band.
In addition to the technical picture, fundamental data and the timing of their release should also be taken into account.
Explanation of illustration:
Ichimoku Indicator:
Tenkan-sen-red line.
Kijun-sen – blue line.
Senkou span a – light brown dotted line.
Senkou span B – light purple dotted line.
Chikou span – green line.
Bollinger Bands Indicator:
3 yellow lines.
MACD:
Red line and histogram with white bars in the indicator window.
The material has been provided by InstaForex Company - www.instaforex.com