Today we take a look at the weekly chart of Gold. Gold price made an important low back in August and since then it is rising. There is potential to move towards $1,300 again but losing $1,200, could be disastrous for bulls.
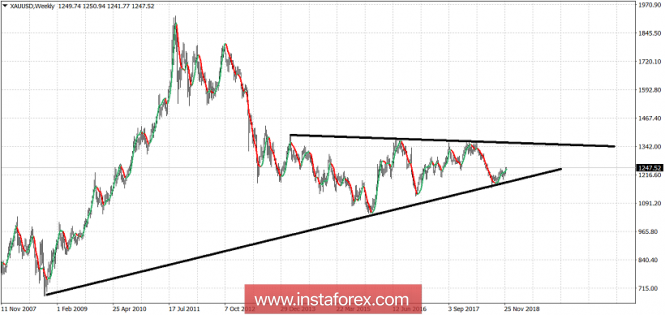
Gold has made a double top on a weekly basis around $1,340-50 area. This is a major resistance level. Breaking above it would open the way for a move towards $1,450-$1,500. Gold during September tried to make a higher high but got rejected. This was a bearish sign of weakness. However the pull back respected the upward sloping trend line and did not make a lower low. Gold price is now bouncing off the upward sloping trend line once again and this could unfold into a bigger rally towards the upper trend line resistance. In the short-term Gold is heading towards $1,250-60 or higher towards $1,285 where we find the 61.8% Fibonacci retracement of the entire decline.
As long as Gold price is trading above $1,200-$1,220 bulls remain in control of the trend. If that level fails to hold, we should expect heavy selling to push prices towards $1,000 or lower.
The material has been provided by InstaForex Company -
www.instaforex.com
